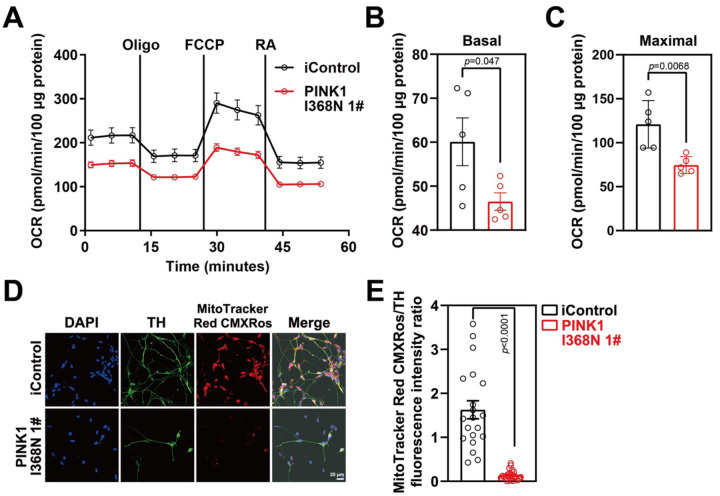
Figure 2. Mitochondrial dysfunction in PINK1 p.I368N-1# mutant DA neurons.
A. Mitochondrial oxygen consumption rate curve generated using Seahorse platform showing the mitochondrial dysfunction in isogenic control and PINK1 p.I368N 1# mutant neurons in the presence of oligomycin, FCCP, and rotenone respectively.
B. Quantification of basal respiration in isogenic control and PINK1 p.I368N-1# mutant neurons. N=3 independent experiments.
C. Quantification of maximal respiration in isogenic control and PINK1 p.I368N 1# mutant neurons. N=3 independent experiments.
D. Representative immunostaining images of TH-positive neurons and MitoTracker Red CMXRos from isogenic control and PINK1 p.I368N 1# mutant neurons.
E. Quantification of TH and MitoTracker Red CMXRos intensity. N=20 TH positive neurons in each group. N=15–30 TH positive neurons in each group.

