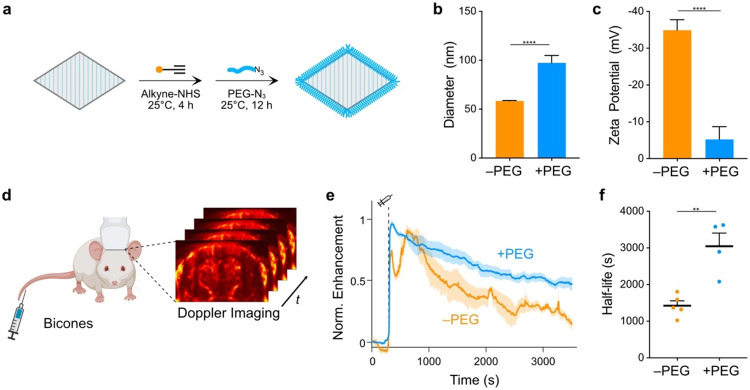
Figure 4. Extension of bicone circulation time.
a) Diagram of PEGylation protocol. Lysines on the bicone surface were functionalized with alkyne groups and attached to 10 kDa mPEGs through a CuAAC reaction. b-c) DLS (b) and zeta potential (c) measurements of PEG-coated bicones. Data from Fig. 1 shown for comparison (−PEG). N = 5. Error bars, ± SEM. Welch’s t-test (****, p < 0.0001). d) Diagram of experimental setup to measure circulation time. Intravascular bicones were visualized by ultrafast power Doppler ultrasound imaging of the brain. e) Normalized time courses of hemodynamic contrast enhancement following IV injection of bicones. Time of injection (300 s) is indicated by a dashed line. Thick lines, mean; shaded area, ± SEM. N = 4-5. f) Circulation half-life calculated by fitting time courses in panel E to an exponential decay function. Error bars, ± SEM. Welch’s t-test, (**, p < 0.01).

