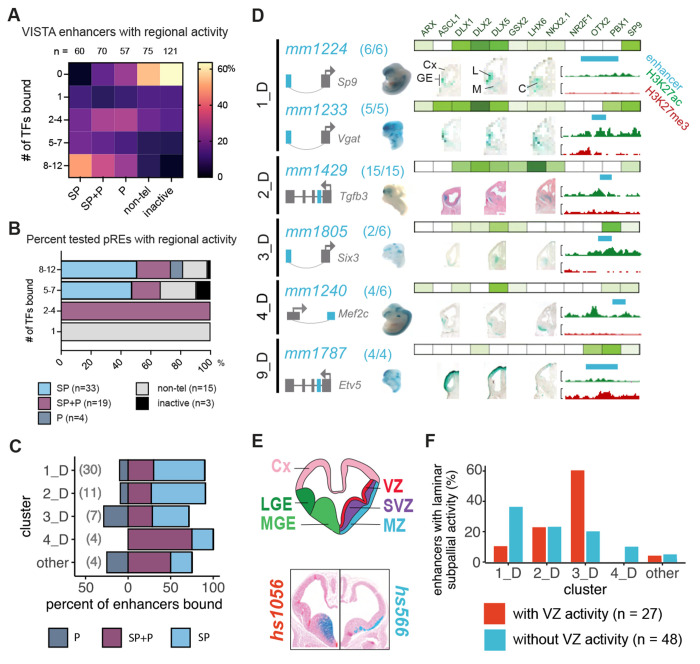
Figure 4 – VISTA and Novel Enhancer Activity across Bound Loci.
(A) Heatmap of combinatorial TF binding (percentage enrichment, 0-12 TFs) on VISTA enhancers that have subpallial (SP), pallial and subpallial (SP+P), pallial (P), non-telencephalic (non-tel), and no activity (inactive). (B) Stacked bar plot showing the percentage of newly identified regulatory sequences with high (8-12 TFs), intermediate (5-7 TFs), low (3-4 TFs), and very low (1 TF) binding in BG showing spatial regional activity. (C) Stacked bar plot depicting percentage of novel enhancers across binding clusters showing restricted spatial enhancer activity in the subpallium, pallium and shared among them. (D) Six pREs representing different clusters that were tested for activity in transgenic mouse assays33. Clusters are shown in the left column, enhancer names are written in turquoise, and the success ratios are listed next to the name (i.e., 6/6 depicts 6 embryos with forebrain activity out of 6 embryos tested). Schemas predict the regulated genes by the tested enhancers (turquoise). The grey arrow depicts the orientation of the TSS. Green bars show the normalized binding of BG TFs, with color intensity proportional to ChIP-seq intensity. The specific TFs bound are shown above the top bar. Wholemounts (WM) and three sections representing the LacZ expression are shown. H3K27ac (green) and H3K27me3 (red) histone ChIP-seq results from the GE are shown to the right; the turquoise bars correspond to the tested genomic regions. Cx: Cortex; GE: Ganglionic Eminences; L: LGE; M: MGE; C: CGE. (E) Coronal brain section schematization showing: 1. the subregions of the primordial BG (LGE and MGE) as well as the cortex (top left hemisection) ; 2. the subregional laminae of the GEs (VZ, SVZ, and MZ; top right hemisection). Hemisections from 2 VISTA enhancers with specific sub regional activity are shown below with hs1056 showing activity in the VZ and SVZ of the MGE (bottom left hemisection) and hs566 showing activity in the mantle zones of the MGE and LGE (bottom right hemisection). (F) Bar plot depicting cluster classification of enhancers with VZ and non-VZ activity (n=99). See also Figure S4.

