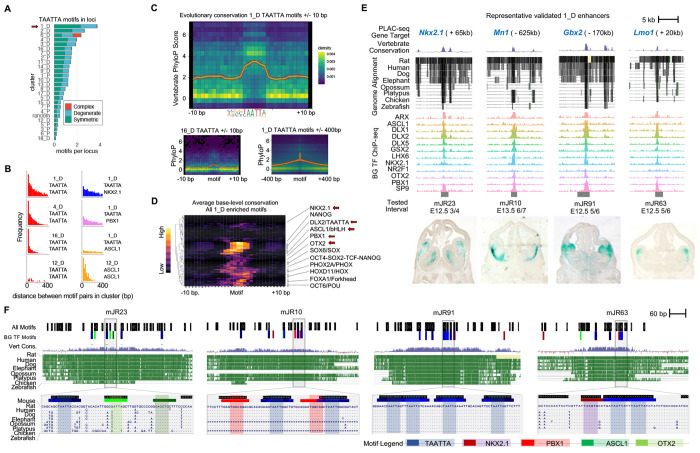
Figure 5 – Arrayed TAATTA motifs anchor deeply-conserved GABAergic enhancers.
(A) Relative number of TAATTA motifs within each RE across clusters separated by symmetric, degenerate, and complex instances. (B) Histogram showing distribution of distance in base pairs between all motif pair occurrences within REs for selected clusters and motif pairs. (C) Average base-level sequence conservation (vertebrate PhyloP score) for TAATTA motif and flanking DNA for 1_D (top) and 16_D (bottom left) within 10bp of motif, and for 1_D out to 400bp of motif (bottom right). (D) TAATTA motifs exhibit the strongest base-level conservation across TF motif families enriched in 1_D REs. Enriched motifs with significant base-level conservation increase compared to 10bp flanking sequence labeled, primary motifs from BG TFs in bold. (E) Four representative 1_D REs with enhancer activity. Target gene, evolutionary conservation, BG TF binding, and enhancer activity in E12.5 mouse telencephalon. (F) Motif and evolutionary conservation landscape for enhancers in (d) showing motif clustering and overlap with conserved regions across core 500bp (top) and at single-base resolution (bottom) for selected intervals. Legend shows colors for BG TF primary motifs and all Homer motifs. See also Figure S5.

