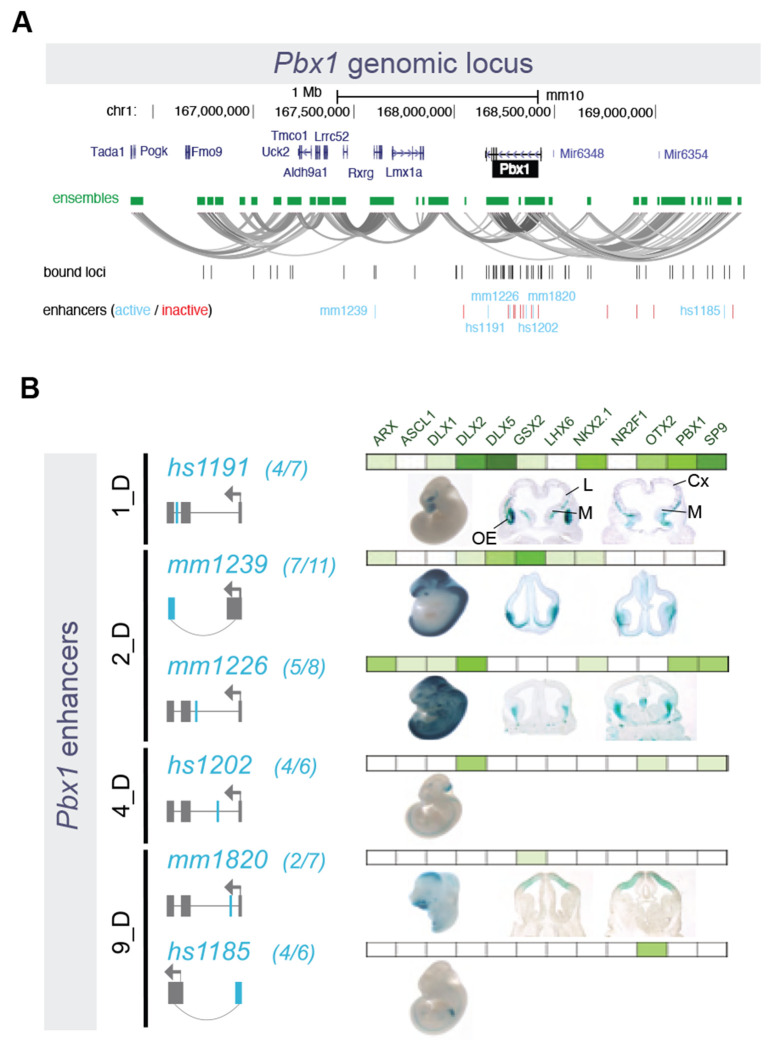
Figure 6 – Pbx1 Genomic Locus and Associated Putative Enhancers.
(A) Representation of the Pbx1 locus, showing nearby genes, and the ensemble of PLAC-seq contacts creating a tridimensional structure made of multiple loops. Bound genomic loci are noted underneath in black, and enhancers are marked in turquoise and red (active and inactive, respectively). (B) Six enhancers around the Pbx1 locus exhibited activity in transgenic mouse assays. Of these, 1_D and 2_D enhancers were active in subpallium, while one 9_D enhancer was active in in pallium and the other 9_D and a 4_D enhancer showed non-telencephalic activity.

