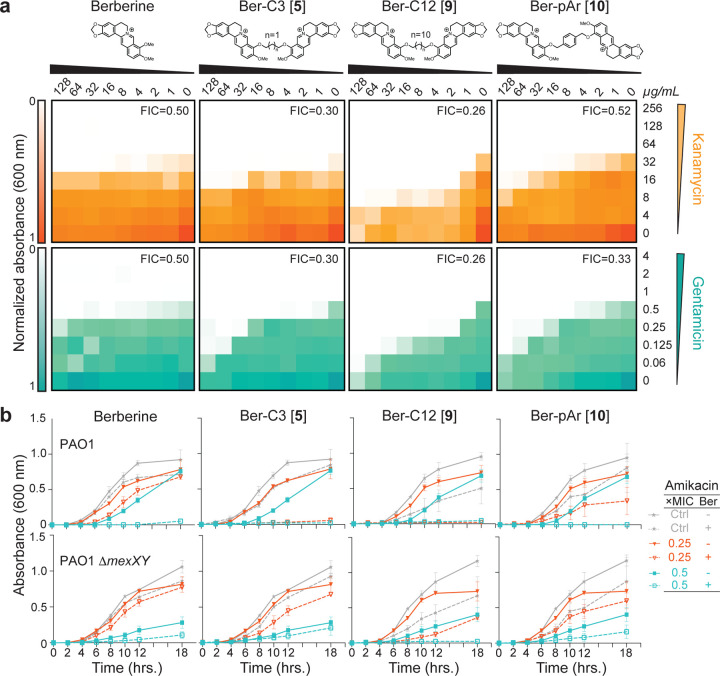
Figure 4. Top di-berberine conjugates exhibit increased synergy with aminoglycosides compared to berberine.
(a) Checkerboard synergy assays with berberine and top selected di-berberine conjugates in P. aeruginosa PAO1. Increased synergy is observed with all ligands and kanamycin (top, orange) and gentamicin (bottom, teal) compared to natural berberine. The lowest fractional inhibitory concentration (FIC) score obtained is shown in the top right corner of each plot. Data are shown as the normalized mean of the optical density (OD600) of two biological replicates (0 is no growth, and 1 is maximum growth). (b) Time-kill assays for berberine and di-conjugate analogs at 64 µg/mL performed over 18 hours in both P. aeruginosa PAO1 (top) and its mexXY isogenic knockout (bottom). Synergy was observed with amikacin for all ligands tested, and Ber-C3 [5] and Ber-C12 [9] reduced the MIC four-fold (red open triangle) compared to no di-berberine conjugate (red filled triangle). Berberine and Ber-pAr [10] reduce the MIC by only two-fold (teal open square) at the tested concentration compared to no diberberine conjugate (teal filled square). Significant aminoglycoside-independent growth inhibition is observed for Ber-C12 [9] (dashed grey line) compared to the no antibiotic growth control (grey line). Two-fold reduction of the MIC (black open square) for Ber-C12 [9] in P. aeruginosa PAO1∆mexXY also suggests off-target activity. Data are shown as the average OD600 of biological replicates, each with two technical replicates, with error bars representing the standard deviation.

