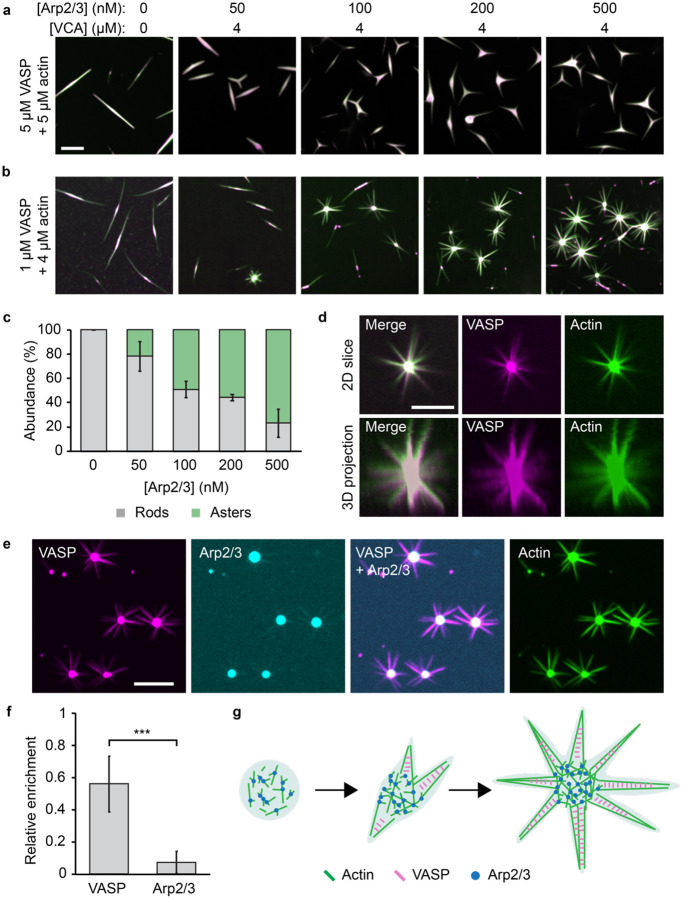
Figure 6. At high actin-to-VASP ratios, Arp2/3 activity drives aster-like morphologies.
(a) Titration of Arp2/3 and 4 μM VCA in droplets formed from 5 μM VASP and exposed to 5 μM actin. Scale bar 5 μm. (b) Titration of Arp2/3 and 4 μM VCA as in (a) into droplets formed from 1 μM VASP and exposed to 4 μM actin. Scale bar 5 μm. (c) Quantification of the percent of droplets that deformed into rods and asters in (b). Bars are mean±SD across n=3 experiments, with at least 4 images analyzed per condition. (d) 3D projection of a representative aster-shaped droplet. Scale bar 5 μm. (e) Representative images of VASP, Arp2/3, and actin intensity distributions throughout aster-shaped droplets. Condition: 1 μM VASP, 500 μM Arp2/3, 4 μM VCA, 4 μM actin. Scale bar 5 μm. (f) Quantification of the relative enrichment of VASP and Arp2/3 to the spokes of aster-shaped droplets. Enrichment is normalized to actin intensity. Droplets formed as in (e). Bars are mean±SD across n=3 experiments, with 10 droplets analyzed per experiment. Asterisks indicates data tested for significance via an unpaired two tailed t-test, with p < 0.001. (g) Proposed model for Arp2/3- and VASP- mediated aster formation.

