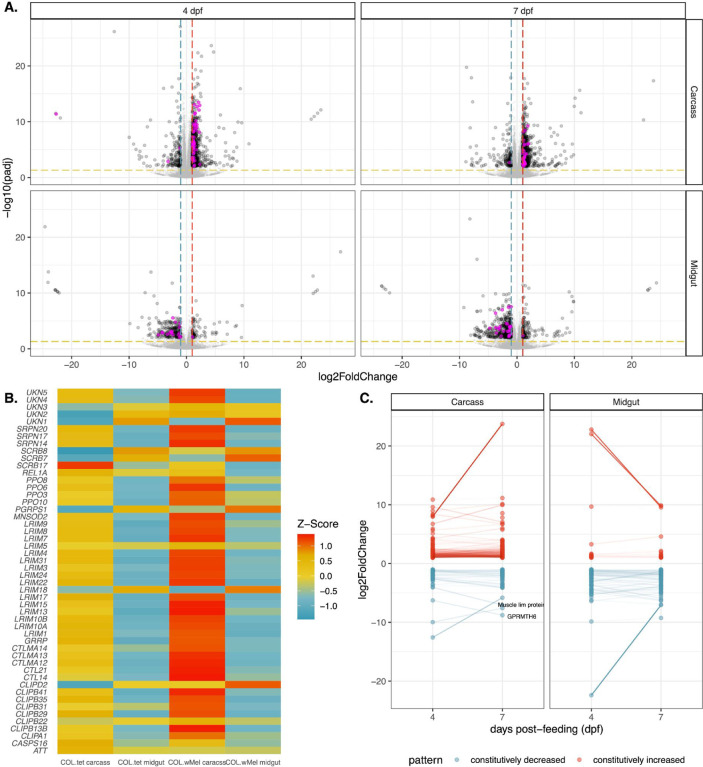
Fig 2. Transcriptional changes in COL.wMel relative to COL.tet.
(A) Volcano plots depicting differentially expressed transcripts in midgut and carcass tissues at 4 and 7 dpf, highlighting Aedes aegypti predicted innate immune genes (highlighted in magenta). Significant changes are transcripts with |log2FoldChange| >1 (vertical red and blue dashed lines) and -log10(padj) > 0.05 (horizontal yellow dashed line). (B) Heatmap of differentially expressed mosquito innate immune genes in COL.wMel and COL.tet mosquitos that were exposed to an uninfected bloodmeal. The list of predicted innate immune genes was chosen from transcripts differentially regulated in COL.wMel carcass tissue 4dpf. (C) Transcripts with constitutively increased abundance (red) and decreased abundance (blue) across both collection time points. Transcripts with a difference in log 2 FoldChange > 2.5 and that are annotated in VectorBase are labeled. Muscle lim protein (VB ID: AAEL019799). GPRMTH6 (VB ID: AAEL011521). No genes went from being significantly increased to significantly decreased or vice versa between 4 dpf and 7dpf.

