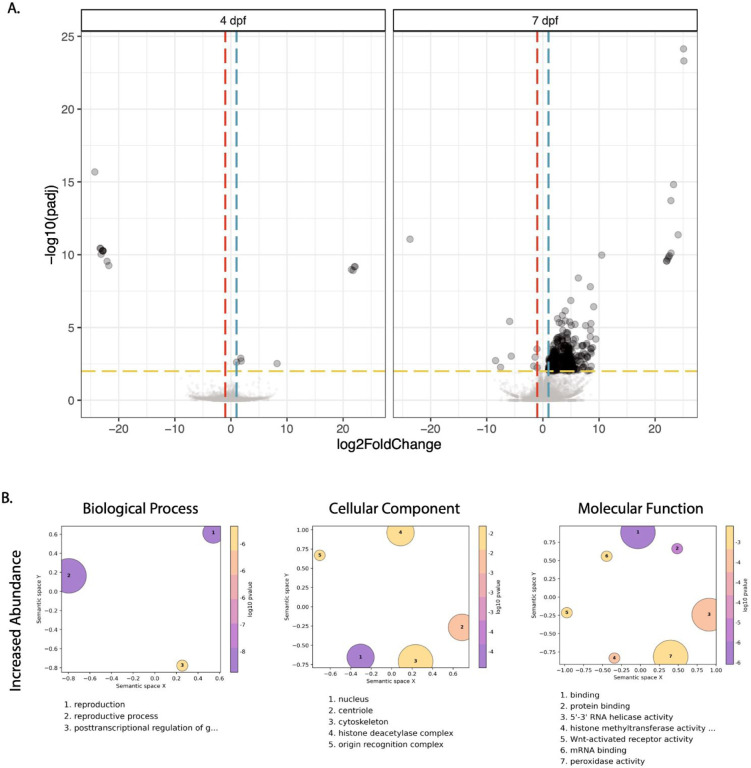
Fig 7. Differentially expressed transcripts and gene ontology analysis in COL.tet midguts 7 days post-feeding on ZIKV-infected mice.
(A). Volcano plots demonstrating differentially expressed transcripts in the midgut of COL.tet midguts. Significant changes are transcripts with |log2FoldChange| >1 (vertical red and blue dashed lines) and -log10(p-adjusted) > 0.05 (horizontal yellow dashed line). (B). GO terms associated with transcripts with an increased abundance in COL.tet midguts 7dpf. Terms are ranked by lowest log10(p-value). The size of each graphical point corresponds to the number of topGO terms associated with the listed summarizing term.

