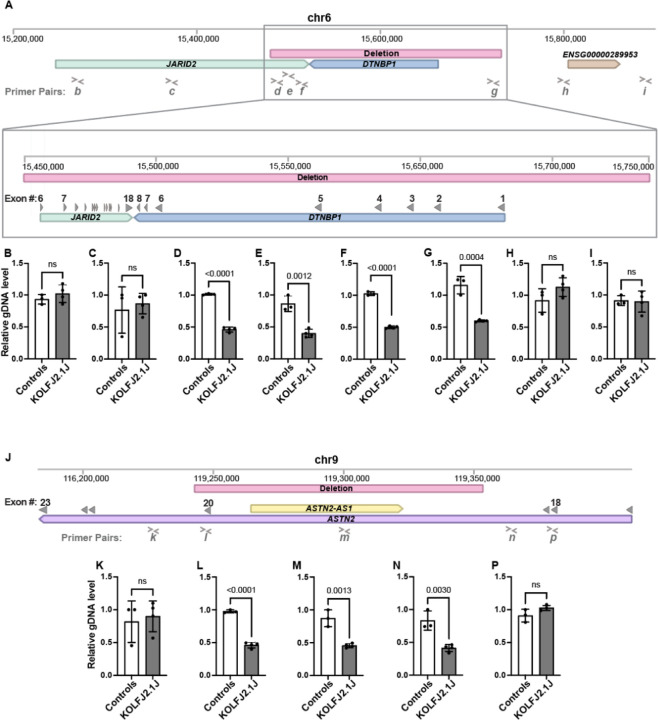
Figure 2: gDNA qPCR analysis confirms the presence of chr6p22 and chr9q33 CNV in KOLF2.1J iPSCs.
(A) Schematic representation of Chromosome 6 (Chr6:15,200,000–15,900,000). Window illustrates the 0.2 Mb deleted region (red bar) and affected genes, JARID2 (green bar) and DTBNP1 (blue bar). (B-I) Genomic DNA qPCR results showing half levels of amplification within the Chr6 deleted CNV region in KOLF2.1J compared to control iPSCs (D-G) and regions upstream and downstream of the deletion (A-B and H-I). (J) Schematic representation of Chromosome 9 (Chr9:116,200,000–119,400,000) with the 0.1 Mb deleted region (red bar) and affected genes, ASTN2 (purple bar) and ASTN-AS1 (yellow bar). (K-P) Genomic DNA qPCR results showing half levels of amplification within the Chr9 deleted CNV region in KOLF2.1J compared to control iPSCs (L-N) and regions upstream and downstream of the deletion (K and P). Graphs show mean +/−SD of n=3 control hPSC lines and n=4 KOLF2.1J iPSC independent stocks. p-values were calculated with a two-sided unpaired t-test. ns=non-significant. Grey filled arrowheads indicate exons. > and < symbols indicate qPCR primer pair positions.

