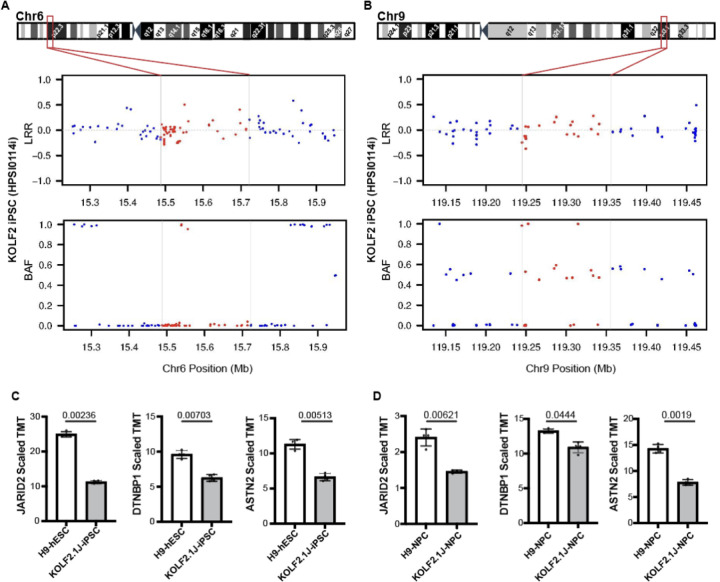
Figure 4: Chr6p22 and Chr9q33 CNVs arose in vitro and affect the expression of JARID2, DTNBP1 and ASTN2 genes.
(A, B) LRR and BAF plots of the KOLF2 iPSC line SNP array show diploid Chr6 (A) and Chr9 (B) regions, indicating that the CNVs arose in culture between KOLF2 to KOLF2.1J generation. Horizontal lines and red dots depict SNPs that fall within KOLF2.1J CNV regions. (C, D) Quantitative proteomic data retrieved from Nam et al51 show that JARID2, DTNBP1 and ASTN2 protein levels are ~half in KOLF2.1J compared to the reference H9 line at both pluripotency (C) and neural progenitor stage (D). Graphs show mean +/−SD of n=4 cultures and q-values as calculated in the reference proteomic analysis with Welsch’s t-test and FDR correction for multiple comparisons51.

