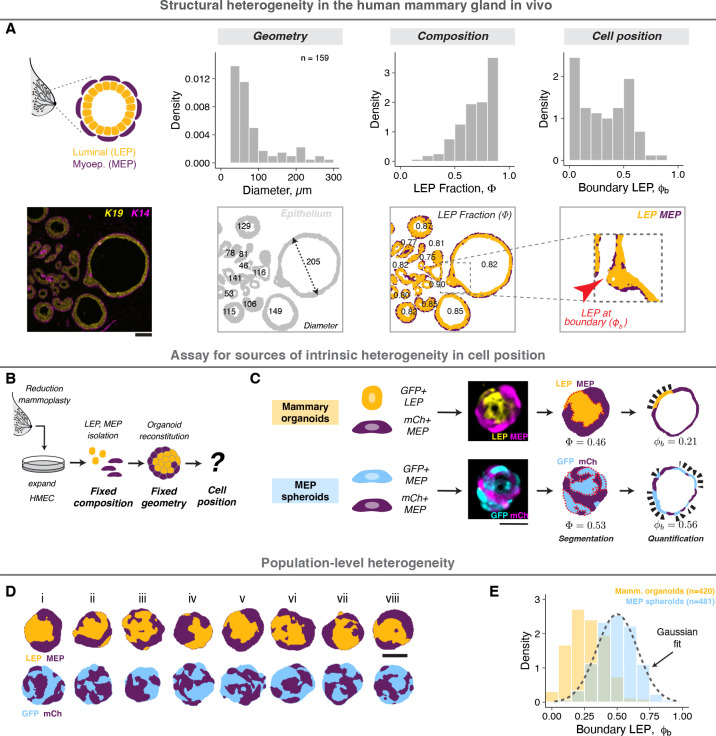
Figure 1: Cell positioning is intrinsically heterogeneous in vivo and in vitro.
A. A representative section of normal human mammary gland stained for keratin 19 and 14 (LEP and MEP markers, respectively). The cells are arranged in a bilaminar structure with MEP surrounding LEP (order), however the tissue also exhibits large variance in local geometry, cell proportions and cell positioning (disorder). A custom analysis workflow was used for pixel segmentation and image quantification (Supplemental Information). The density histograms show the distributions for effective tissue diameter (d), LEP proportion and LEP positioning at the tissue boundary . Analysis of tissue objects from 14 donors is shown. Scale bar = 50 μm.
B. Reconstituted organoids provide an in vitro model to study intrinsic sources of positional heterogeneity in tissues with defined composition and geometry. Finite-passage human mammary epithelial cells (HMEC) were isolated from breast reduction mammoplasty, expanded in vitro, sorted as single cells and reaggregated in defined numbers and proportions. Organoids were cultured in Matrigel for 2 days.
C. Mammary organoids contained similar number of GFP+ LEP (gold) and mCh+ MEP (purple). MEP spheroids contained similar number of GFP+ MEP (blue) and mCh+ MEP. Confocal images were processed to quantify the total LEP/GFP fraction and the boundary LEP/GFP fraction (Supplemental Information). For each organoid, three central sections spaced 5 μm apart were analyzed. Scale bar = 50 μm.
D. Processed mammary organoid and MEP spheroid images following segmentation illustrate population-level structural heterogeneity. Scale bar = 50 μm.
E. Probability density histograms showing the population distribution of mammary organoids (gold) and MEP spheroids (blue) two days post-assembly. The dashed line represents a Gaussian fit to the MEP spheroid distribution. The number of observations is noted at the top right of the graph.

