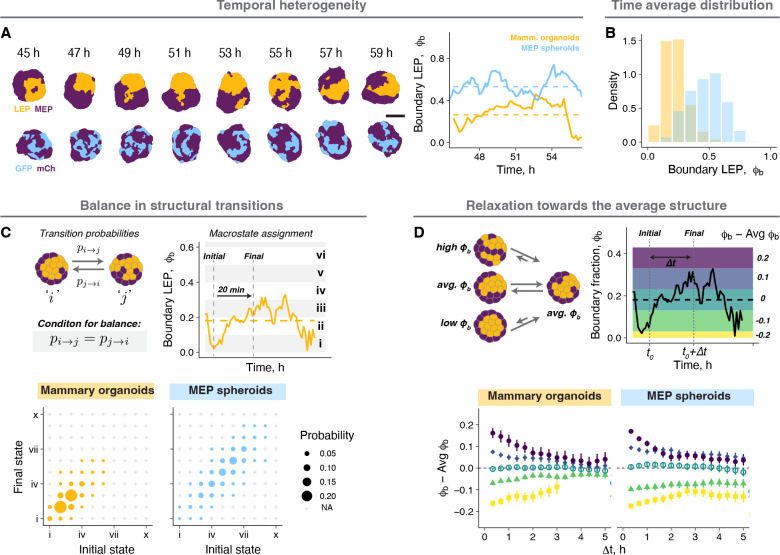
Figure 2: Tissues dynamically sample from the ensemble steady state distribution.
A. Snapshots from time lapse microscopy after segmentation for a representative mammary organoid and MEP spheroid illustrate temporal structural heterogeneity at the steady state. Scale bar = 50 μm. Quantification of fluctuations in over time for the examples shown. Dashed line is the average of over time for the corresponding tissue.
B. Probability density histograms showing the temporal distribution of a small number of mammary organoids and MEP spheroids at the steady state.
C. Organoids at different timepoints were binned into 10 structural states according to their . The probability of transitioning between any two structural states over a 20 min window is represented by the size of the circles. Any transitions not observed during this window are marked by ‘+’. For organoids at the steady state, the diagonal symmetry of the transition probability matrix suggests there is no net flux across states. The same tissues were used for this analysis as Fig. 2B.
D. Organoids at each time point were classified into 5 groups based on the difference between the instantaneous and average . For each bin, the average structure at different time intervals from the initial classification is plotted. The colors in the graph on the right represent the bins on the example trace. The same tissues were used for this analysis as panel Fig. 2B.

