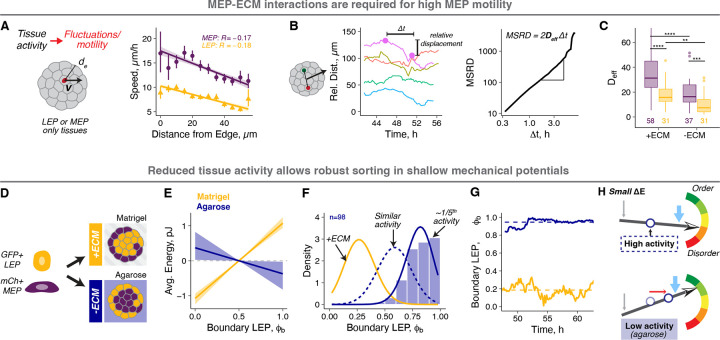
Figure 4: Tissue activity sets the balance between the mechanical potential and macrostate degeneracy.
A. Tissue activity is a measure of the kinetic component of the internal energy of tissues and is associated with cell motility. Cell speeds were measured by tracking cell nuclei in LEP- or MEP-only spheroids using time lapse microscopy ( and 14 respectively). Speeds for MEP(purple) and LEP (gold) as a function of distance from the tissue boundary are shown. The Pearson’s correlation coefficients for linear regression are shown. Average speeds and their 95% confidence intervals are represented by the points and error bars respectively.
B. The effective diffusion coefficients for cells in spheroids were calculated from the trends for the relative distance between cell pairs. This approach eliminates confounding dynamics from whole organoid movements. The left graph shows example traces of relative distance between cell pairs over time for a representative MEP spheroid. The change in relative distance (relative displacement) was calculated for different time intervals and averaged across all times and cell pairs to get the mean squared relative displacement (MSRD). The MSRD vs curves were used to estimate the effective cellular diffusion coefficients for each organoid (Supplemental Information).
C. Effective diffusion coefficients for LEP (gold) and MEP (purple) in the presence and absence of ECM interactions (in Matrigel and agarose microwells, respectively). The lines and hinges for boxplot show the median and the 1st and 3rd quartiles. The number of spheroids analyzed is noted at the bottom of the graph. Asterisks represent the significance of difference between conditions, as follows ns: p > 0.05; *: p < 0.05, **: p < 0.005; ***: p < 0.0005 based on Wilcoxon test.
D. Equal proportions of GFP+ LEP and mCh+ MEP were aggregated and cultured in Matrigel (high activity) or agarose microwells (low activity).
E. The macrostate energy calculations for organoids in Matrigel (gold) and agarose (navy) using the BCC lattice model.
F. The histogram shows probability density for organoids cultured in agarose. The gold line is the fit for organoids in Matrigel (+ECM), and the navy dotted line is the theoretical prediction based on for agarose with no change in activity. The solid navy line is the theoretical fit to the measured distribution, predicting 5-fold lower activity in agarose compared to Matrigel.
G. Structural fluctuations in over time for representative mammary organoids in Matrigel and agarose (gold and navy respectively). Dashed line is the average of for the corresponding condition.

