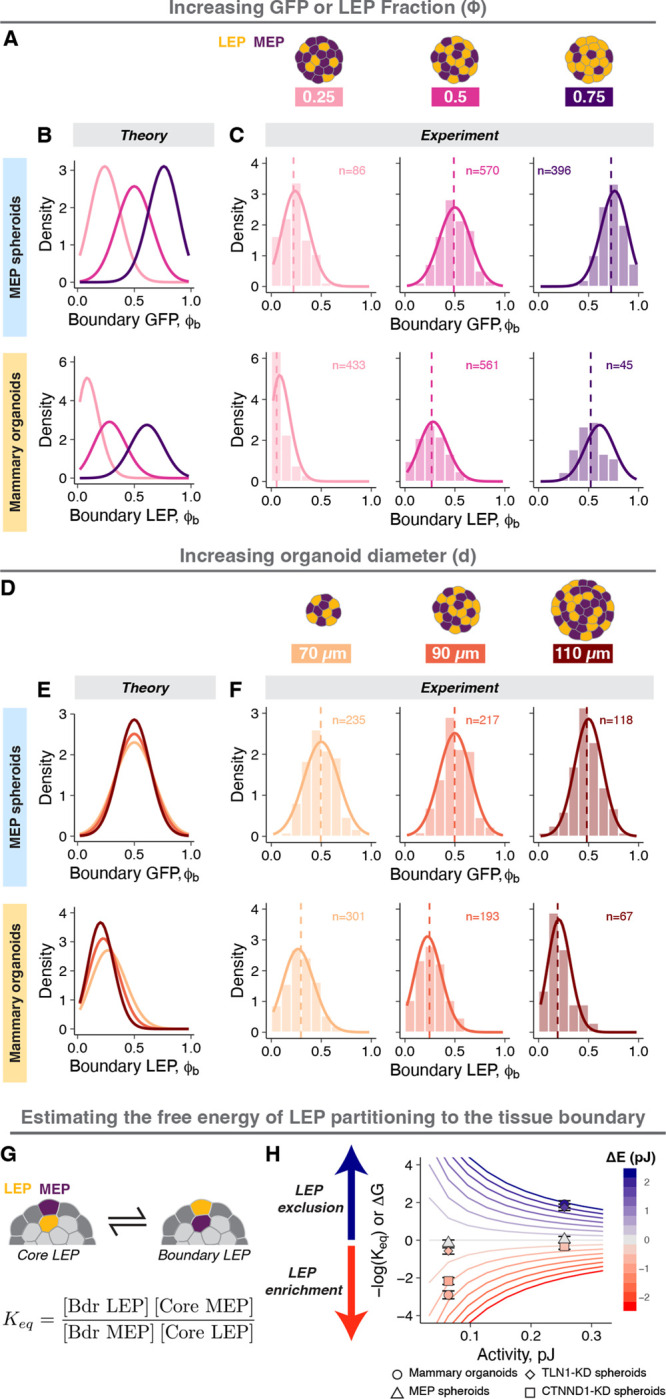
Figure 6: Engineering the structural ensemble by programming macrostate degeneracy.

A. Engineering structure by varying LEP proportion: the proportion of GFP+ LEP in mammary organoids or GFP+MEP in MEP spheroids was varied. Tissues with or 0.75 (light pink, magenta, and dark purple respectively) were generated.
B. Theoretical predictions for MEP spheroids (top row) and mammary organoids (bottom row) with varying .
C. The measured probability densities for MEP spheroids (top row) and mammary organoids (bottom row) with varying . Histograms show the distribution of experimental data, dashed vertical lines are the average , and the solid curves are the theoretical predictions for each condition. The number of observations is noted at the top of the graphs.
D. Engineering structure by varying tissue size: the total number of cells per organoid was varied by changing the tissue diameter. Tissues with average diameter of 70 μm, 90 μm, and 110 μm were generated (light orange, orange, and brown respectively). The cell proportions were held constant .
E. Theoretical predictions for MEP spheroids (top row) and mammary organoids (bottom row) with varying size.
F. The measured probability densities for MEP spheroids (top row) and mammary organoids (bottom row) with varying size. Histograms show the distribution of experimental data, dashed vertical lines are the average , and the solid curves are the theoretical predictions for each condition. The number of observations is noted at the top of the graphs.
G. The equilibrium constant for the partitioning of LEP between the tissue core to the boundary was calculated from the average occupancy of LEP and MEP in the tissue boundary and core. The free energy change associated with cell translocation is proportional to and determines the favorability of cell translocation.
H. Calculations of for different mechanical potentials and activities in tissues with a diameter = 80 μm containing equal number of LEP and MEP. The contour lines are predictions from the model and are colored by the value of . Estimated values of for different experimental conditions are also shown, where points and error bars are the average and standard deviations. The symbols represent different conditions ( ○: mammary organoids, △: MEP spheroids, ◇: TLN1-KD spheroids, □: CTNND1-KD spheroids), and the points are colored by their calculated .
