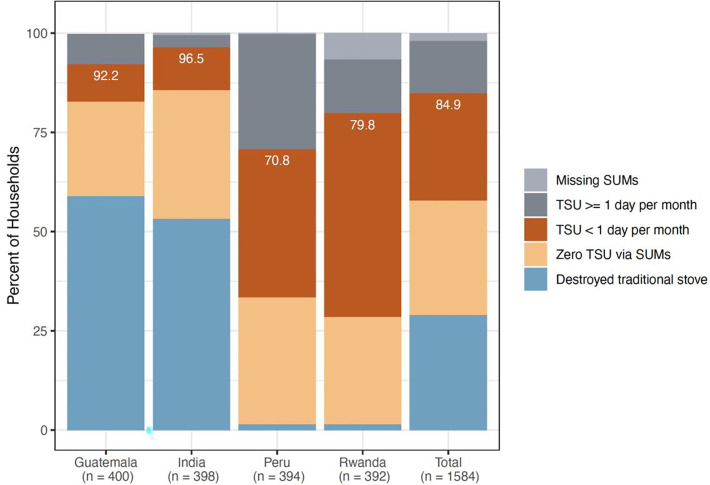
Figure 4.
Percent of intervention households who destroyed their traditional stove at LPG stove installation and have no subsequent SUMs data (blue), had zero traditional stove use (TSU) according to SUMs data (sepia), or had less than one day of TSU per month (red), by country and overall. Percentages displayed in white represent the total percent of participants falling into either of these three categories. Grey bars represent participants with one or more day with traditional stove use per month (dark grey) or who retained their traditional stove but are missing SUMs data (light grey).

