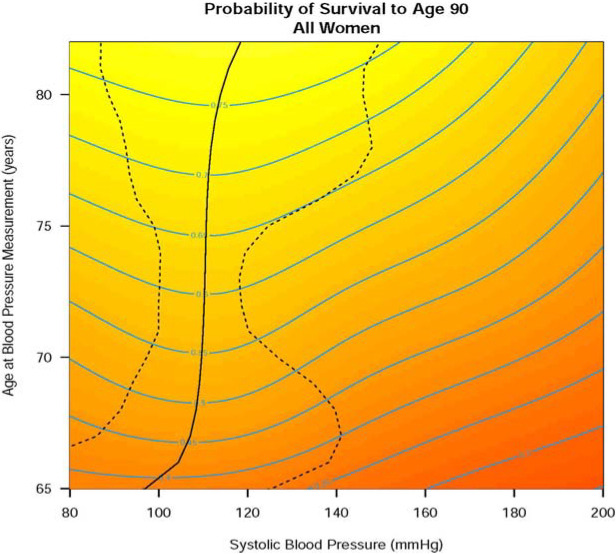
Figure 1. Survival Probability to age 90 years by Age and Systolic Blood Pressure (N=16,570).
Systolic Blood Pressure and Age combinations are displayed to show absolute survival probabilities (%). Bold line indicates SBP levels with highest survival probability for every age. Dotted line indicates 95% confidence interval of optimal SBP. Blue lines are contours of equal survival probability. Yellower areas indicate higher, redder areas indicate lower survival probabilities.

