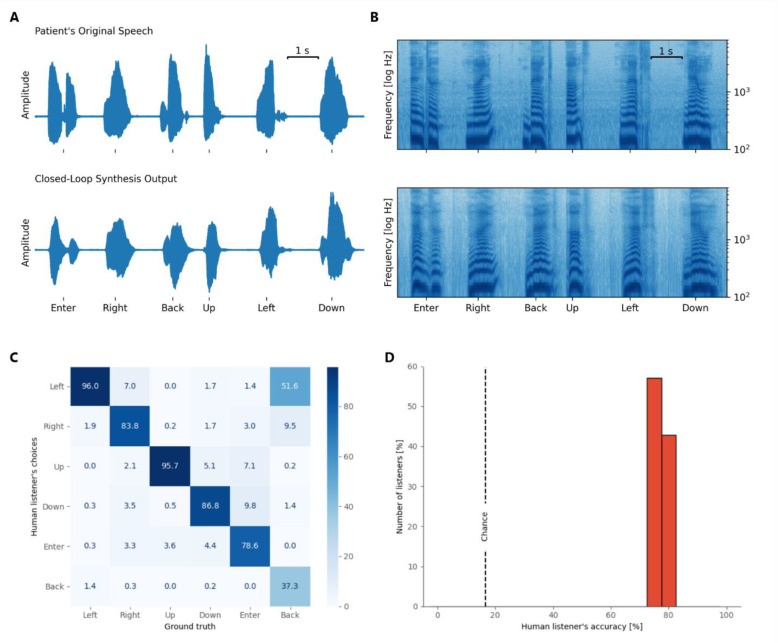
Figure 2 |. Evaluation of the synthesized words.
(A) Visual example of time-aligned original and reconstructed acoustic speech waveforms and their spectral representations (B) for 6 words that were recorded during one of the closed-loop sessions. Speech spectrograms are shown between 100 and 8000 Hz with a logarithmic frequency range to emphasize formant frequencies. (C) The confusion matrix between human listeners and ground truth. (D) Distribution of accuracy scores from all who performed the listening test for the synthesized speech samples. Dashed line shows chance performance (16.7%).

