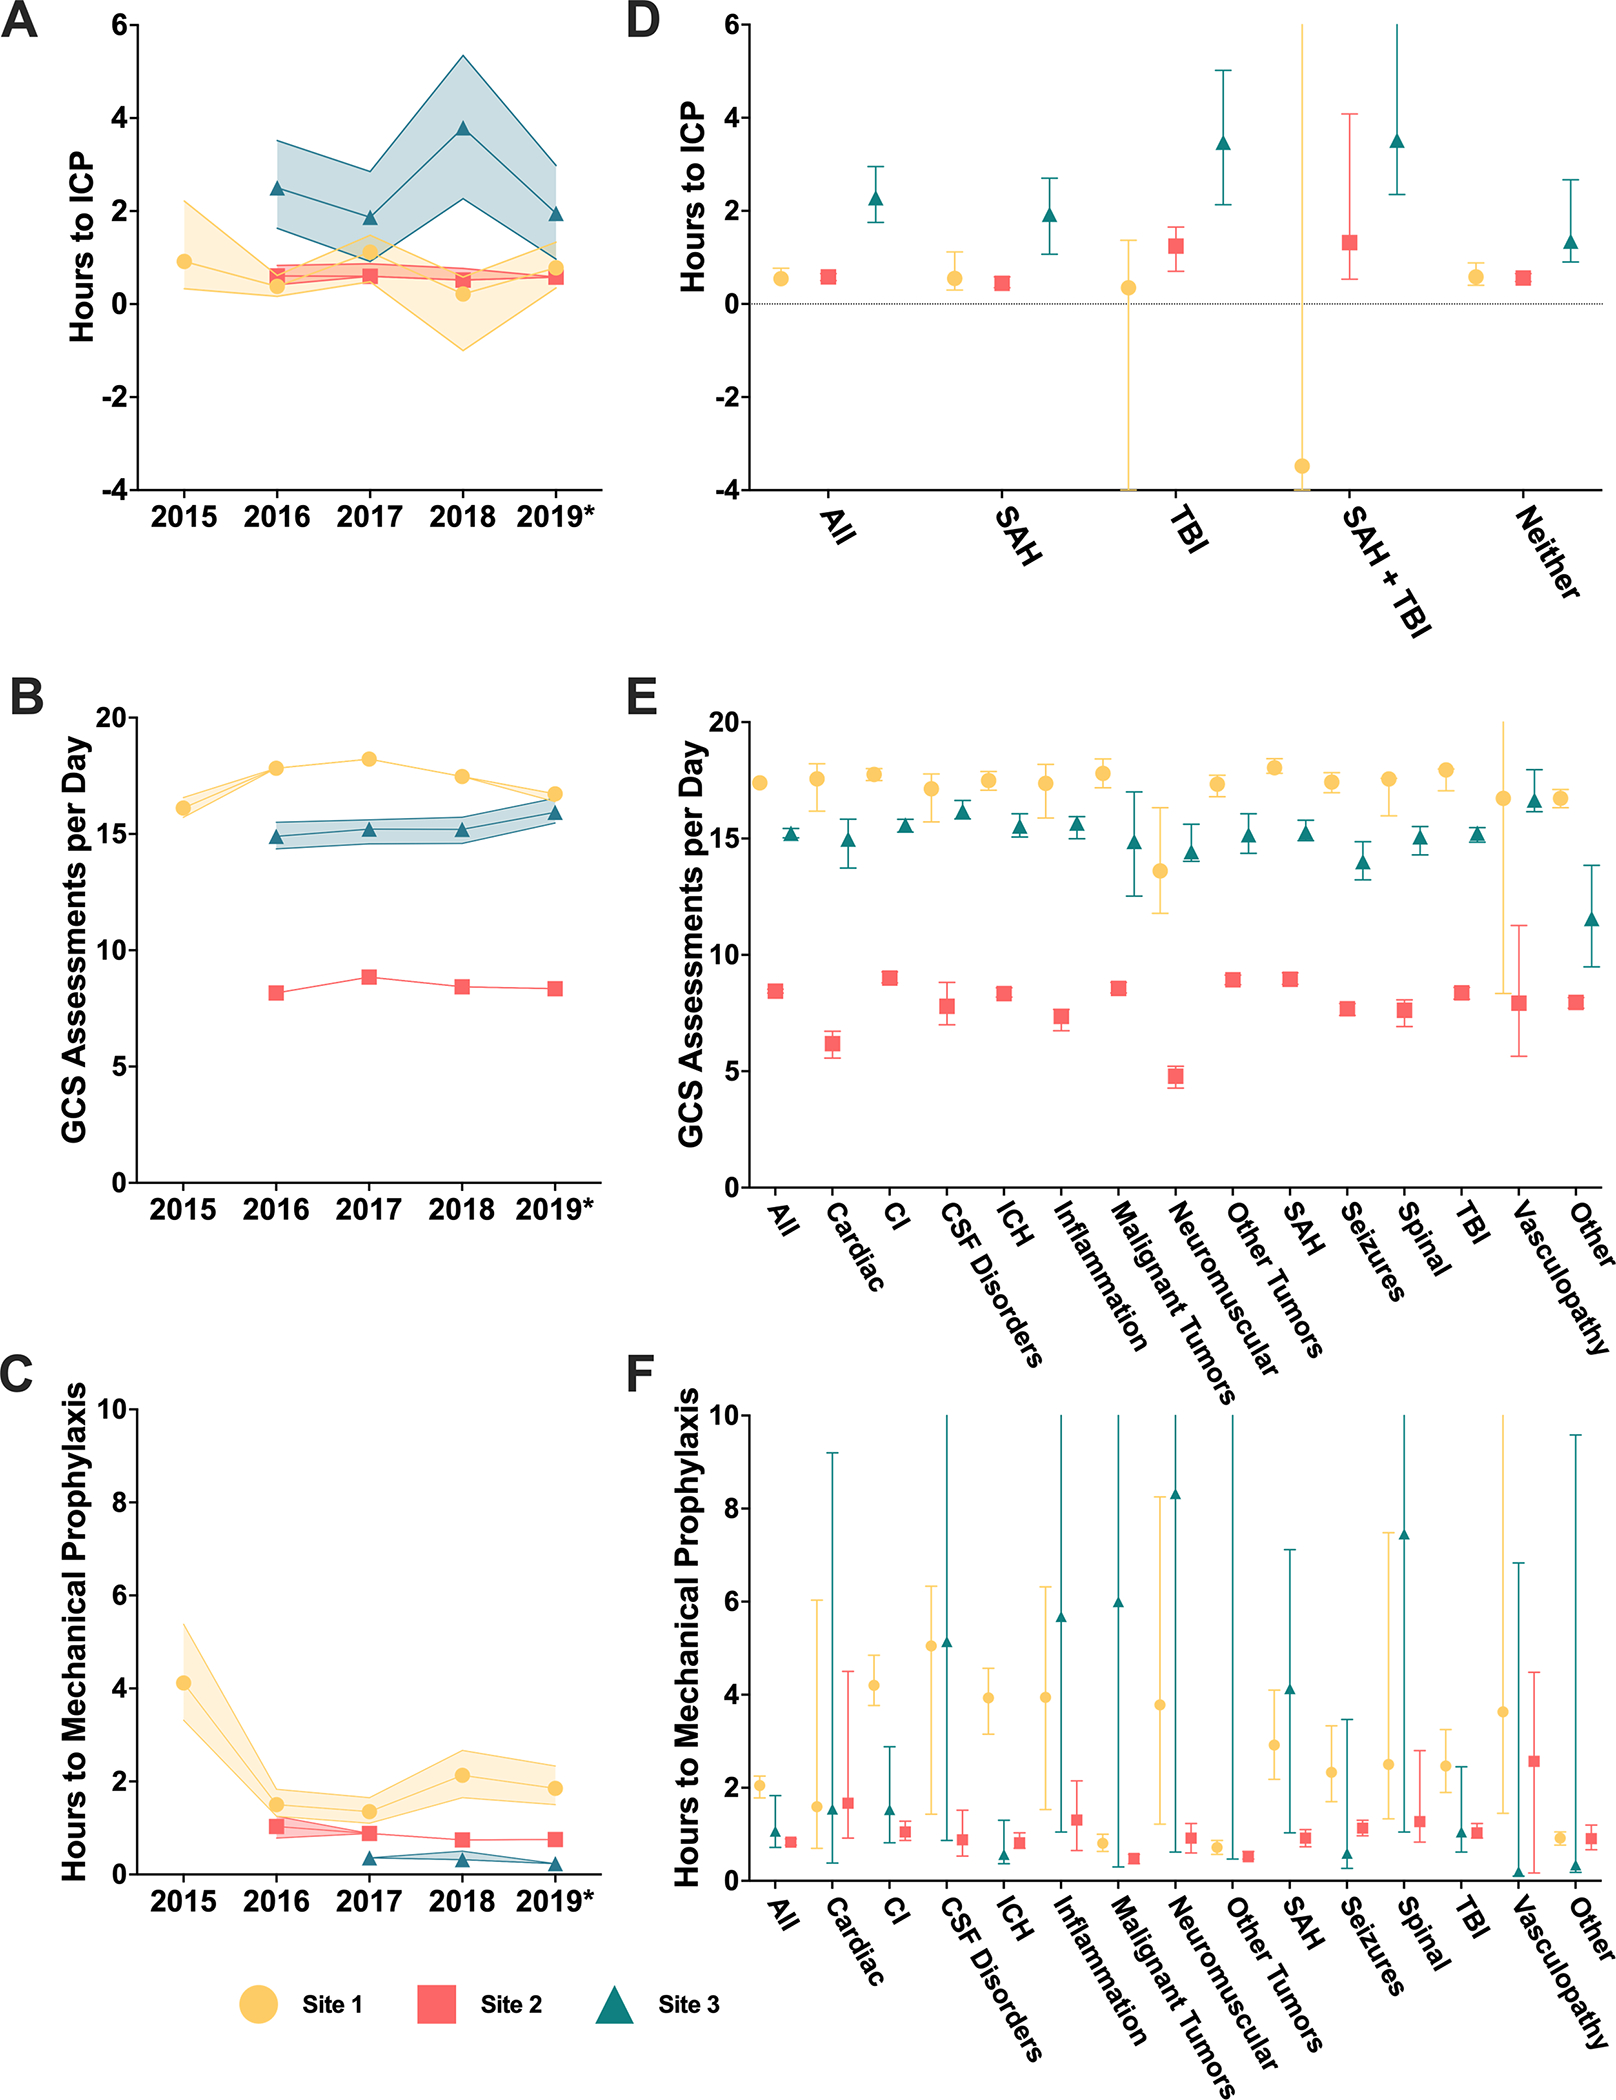
Figure 3.

Analysis of PM metrics over time and by patient diagnosis. Medians and 95% confidence intervals are represented. (A-C) Hours from NCCU admission to first ICP measurement, numbers of GCS assessments documented per admission day, and hours from NCCU admission to documentation of mechanical prophylaxis are evaluated over year of admission. *2019 includes data through February 2020. Between site differences are observed in all three measures across time. (D-F) Hours from NCCU admission to first ICP measurement, numbers of GCS assessments documented per admission day, and hours from NCC admission to documentation of mechanical prophylaxis are evaluated by diagnosis. CI indicates cerebral ischemia and ICH, intracranial hemorrhage. Years with documentation greater 65% are plotted. (D) ICPM is refined by indicating diagnoses (subarachnoid hemorrhage [SAH] and traumatic brain injury [TBI]). Negative values represent ICPM initiation prior to NCCU admission. Between site differences are observed within neither, SAH, and TBI groups. Further differences exist between diagnoses at Sites 2 and 3. (E) Between site differences in frequency of GCS assessment are preserved across diagnosis. (F) Diagnosis affects time to IPCd across sites.
