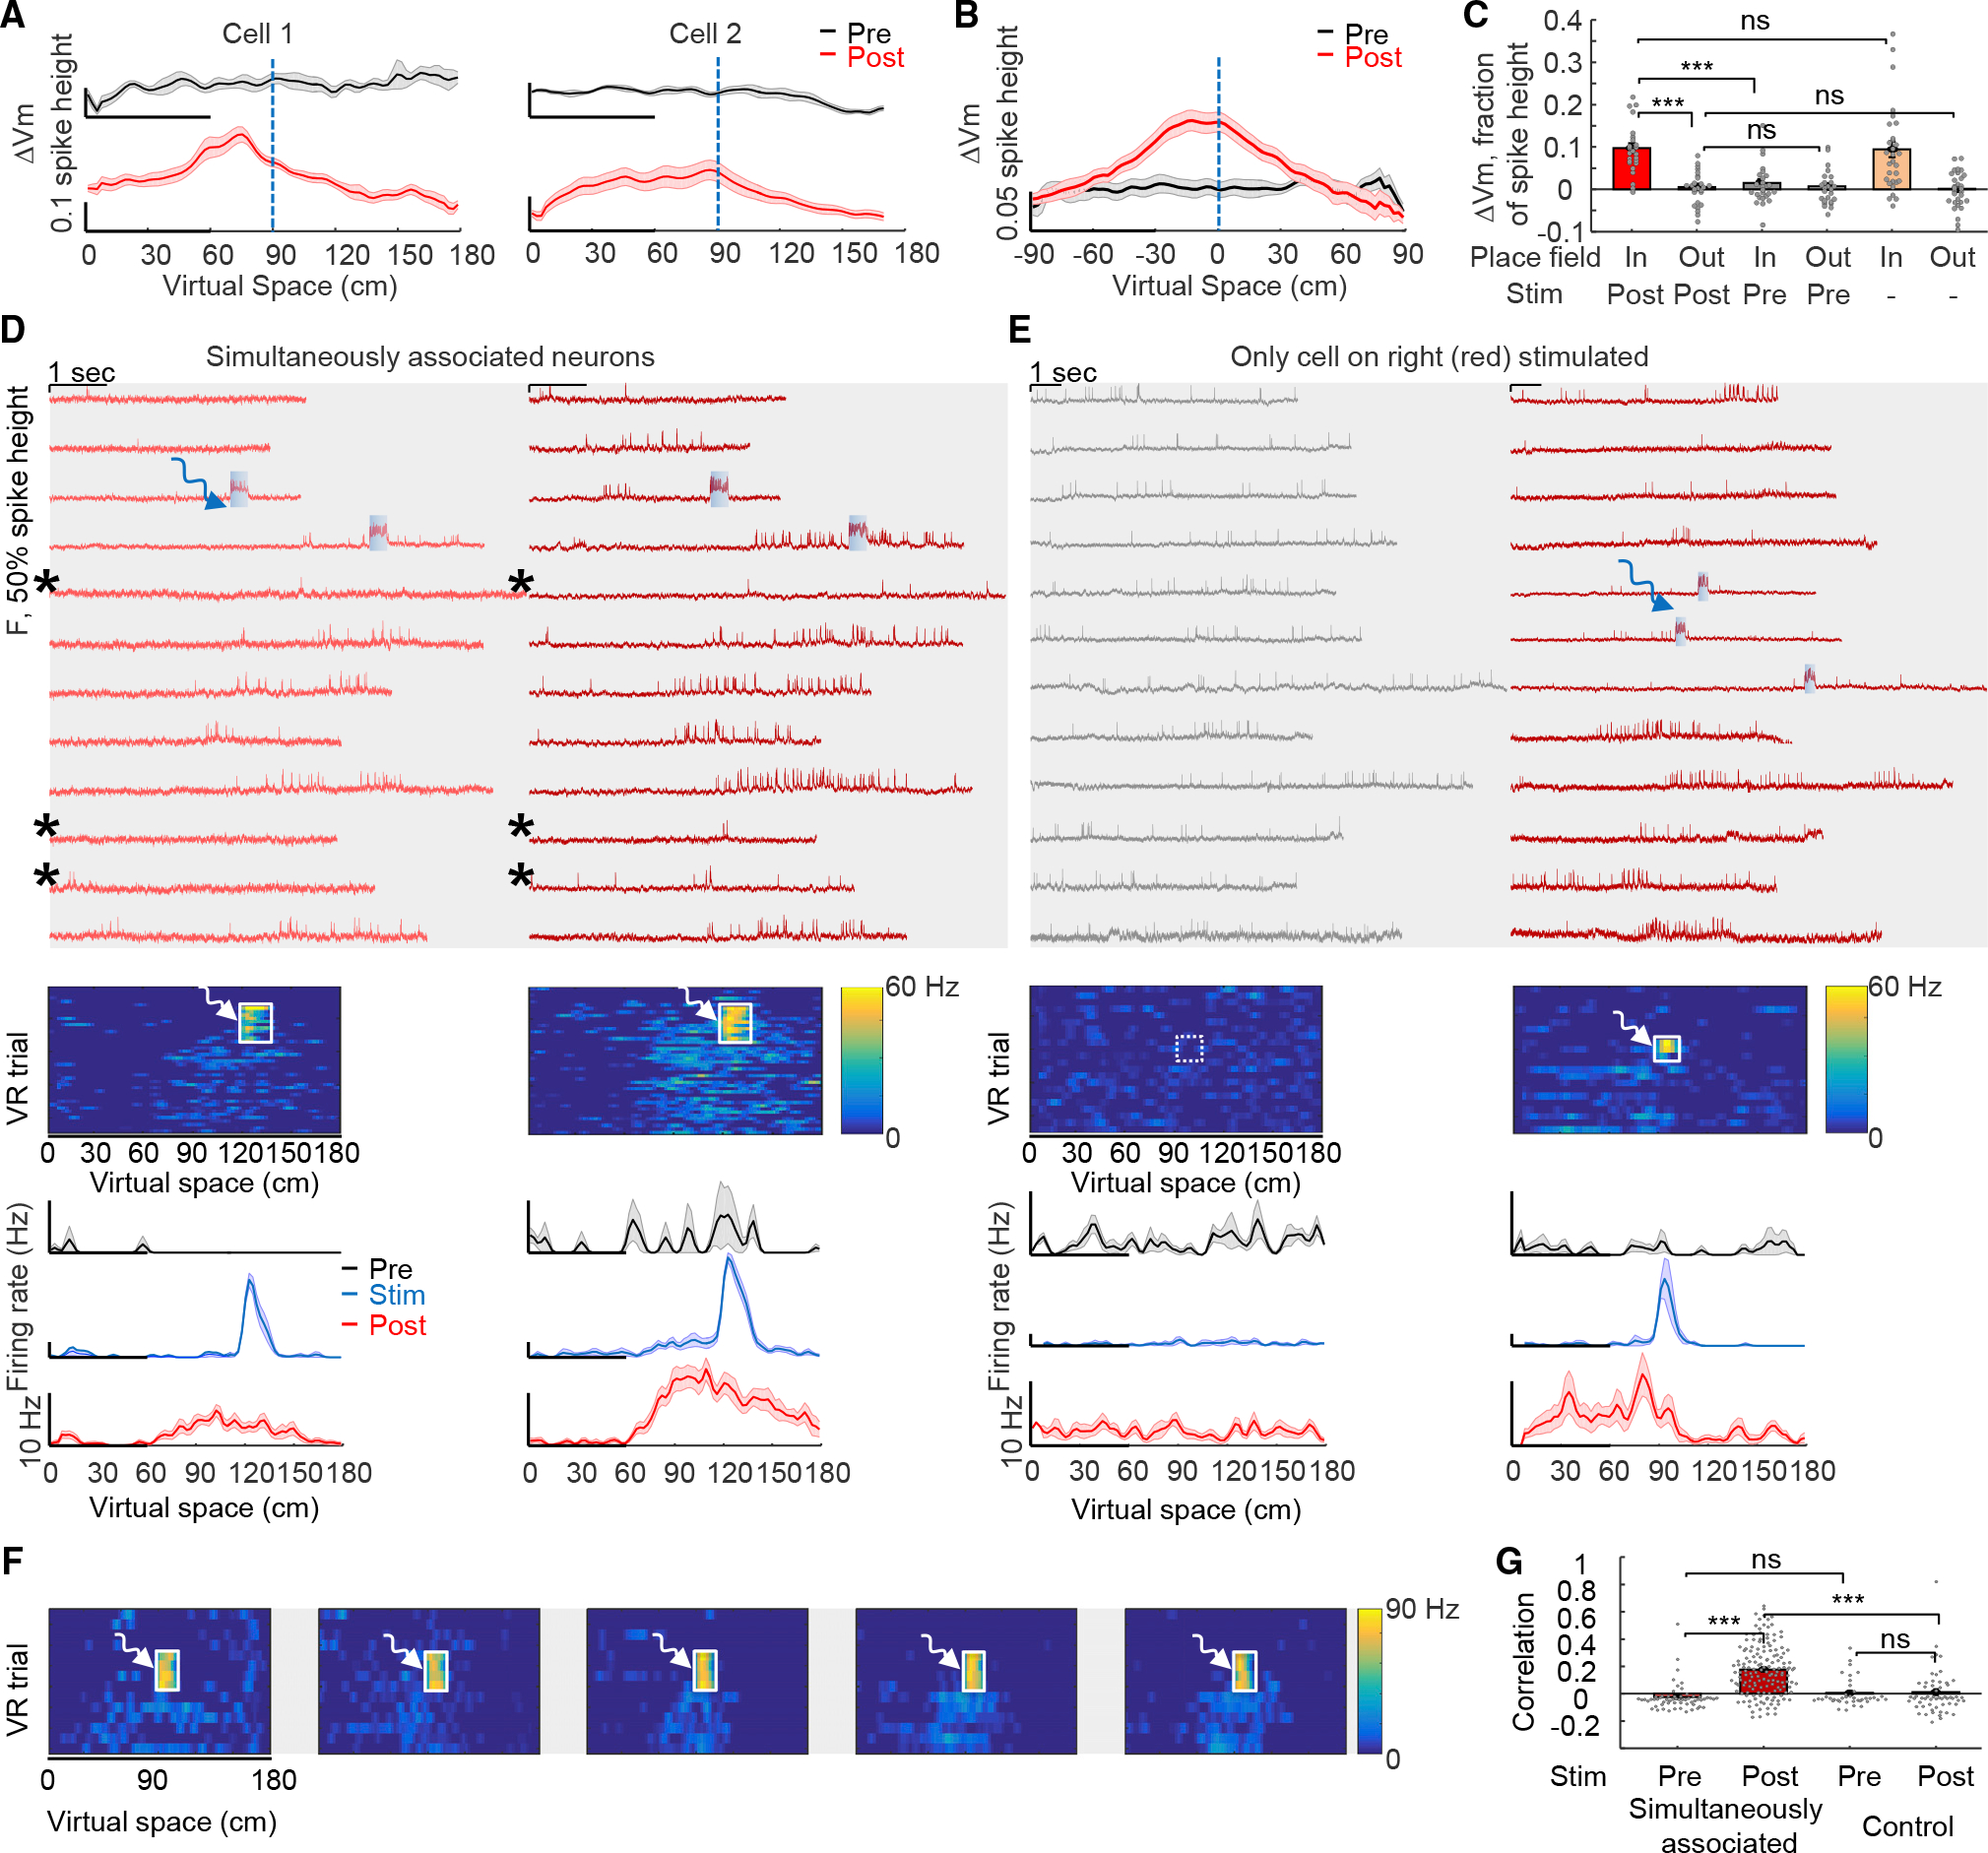
Figure 3. Induced BTSP exhibited enhanced subthreshold potentials and voltage correlations among simultaneously associated neurons.

(A) Mean subthreshold membrane potential changes (spikes removed, low-pass filtered <3 Hz) for cells shown in Figure 2B. Black: pre-optogenetic stimulation. Red: post-optogenetic stimulation.
(B) Mean subthreshold membrane potential (for n = 32 cells aligned at 0 cm).
(C) Optogenetic stimulation did not affect out-of-field membrane potential but did increase in-field membrane potential (n = 25 cells). Optogenetically induced place cells had similar relative in-field and out-of-field membrane potential dynamics as natural place cells; values for natural place cells (orange bars, right) from the dataset in Figure 1.
(D) Example of simultaneously optically stimulated cells forming stable representations at the same location (n = 18 pairs). Red: GEVI fluorescence traces as a function of time for selected VR trials. Blue: simultaneous 300 ms targeted optogenetic stimulation at 120 cm. Gray shaded zones indicate simultaneously recorded cells. Asterisks indicate concurrent spiking failures inside the place field. Middle: Firing rates from all VR trials (pre-, during, and post-optogenetic stimulation) across virtual space. Bottom: mean firing rate maps.
(E) Same as (D) but control condition wherein the left cell is simultaneously imaged but not optogenetically stimulated.
(F) Firing rate across virtual space for simultaneously optically stimulated and associated cells (n = 5 cells).
(G) Pearson’s correlation coefficients of the firing rate over virtual space between simultaneously stimulated cells and between simultaneously imaged cells under control conditions. All error bars and shading: SEM.
