
Fig. 2.
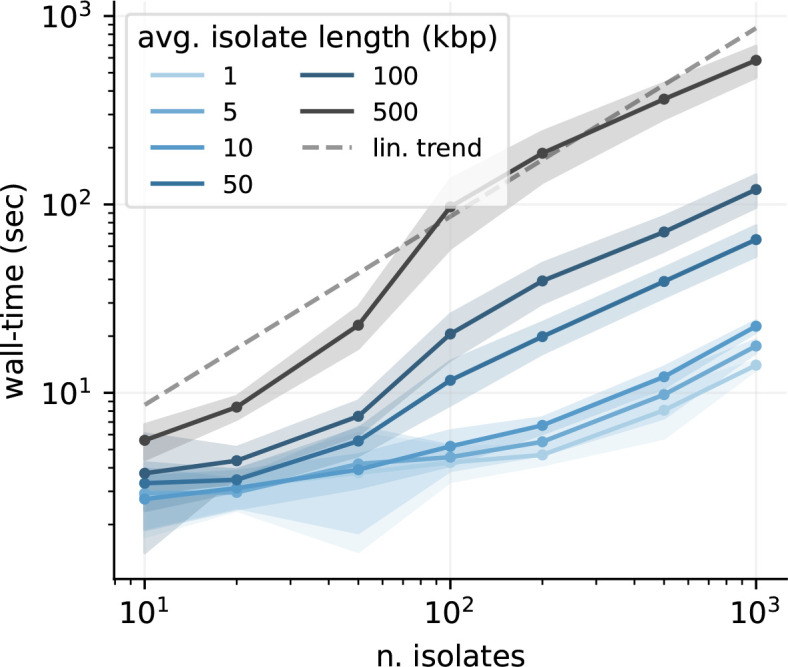
Algorithm performance. PanGraph scales linearly with the number of input genomes. This is a direct result of the guide tree simplification. The solid line and ribbons display the mean and standard deviation over 50 runs. All runs were performed utilizing eight cores, and with the default minimap2 alignment kernel and asm20 option.