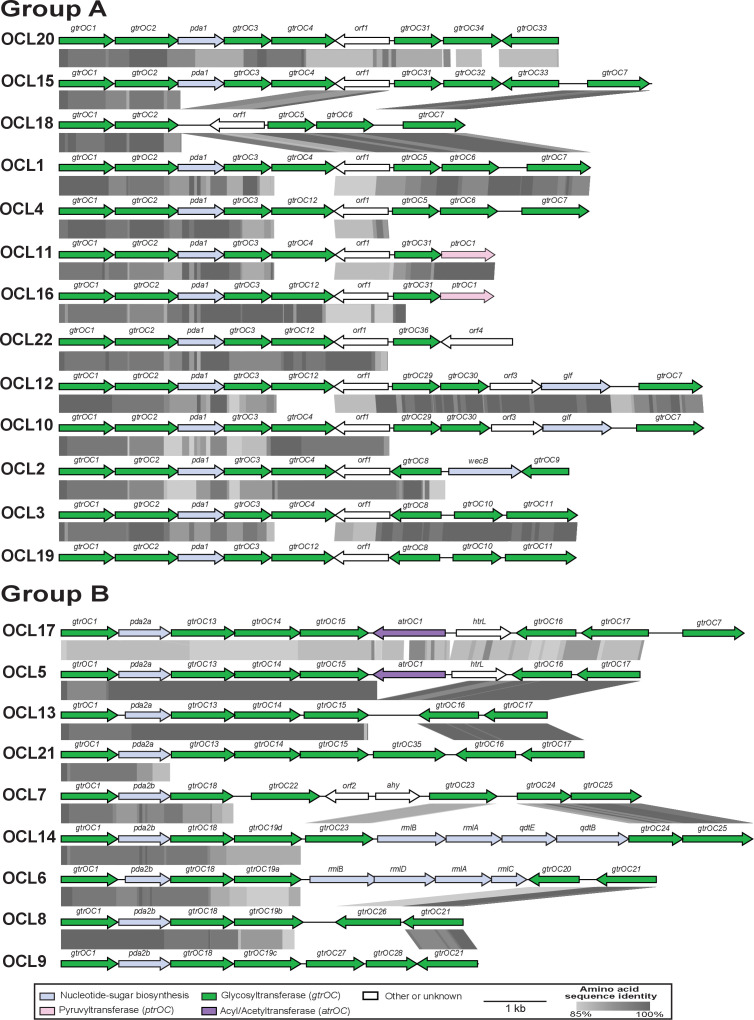
Fig. 2.
Alignment of all identified OCL reference sequences (OCL1–OCL22) separated into group A and group B. Genes are represented by arrows orientated in the direction of transcription that are coloured by the predicted function of their gene products (shown in the key below the figure). Grey shading between gene clusters shows amino acid sequence identities determined by tblastx with the grey scale shown in the key below. Figures drawn to scale using Easyfig [21] and annotated/coloured in Adobe Illustrator.

