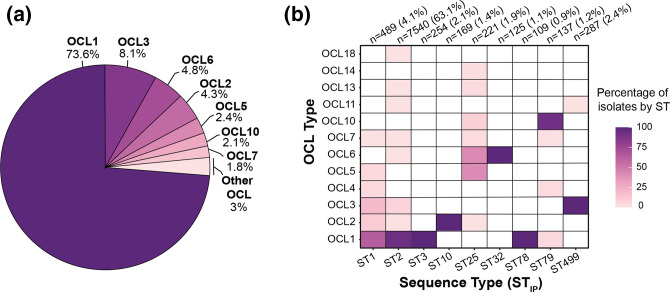
Fig. 3.
Distribution of OCL types amongst A. baumannii genome assemblies. (a) Percentage of OCL best match locus types assigned a confidence score of good or above by Kaptive (n=11 940). (b) Heat map showing percentage of genomes belonging to nine over-represented STs that carry OCL best match locus types assigned a confidence score of good or above by Kaptive. Only STs with ≥100 genomes are shown (total number of genomes=9331: 489 ST1, 7540 ST2, 254 ST3, 169 ST10, 221 ST25, 125 ST32, 109 ST78, 137 ST79, 287 ST499). Figures were created using the ggplot2 package in RStudio [26].

