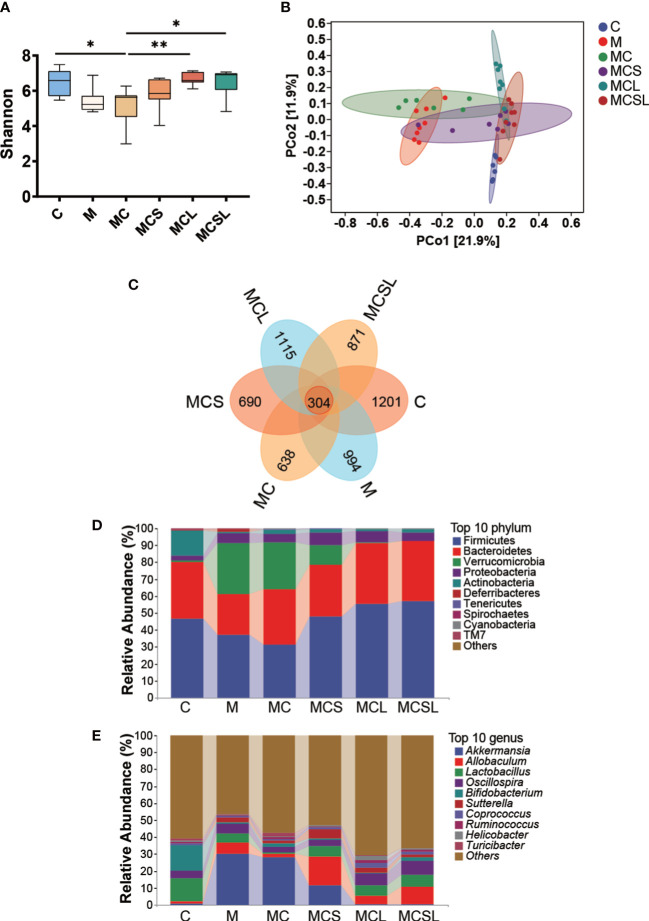
Figure 3.
The combination of THD and C. butyricum reversed dysbacteriosis in CRC mice. (A) The Shannon indexes. (B) Principal coordinate analysis (PCoA). (C) Venn representation. (D) The relative abundance of the bacteria at phylum level. (E) The relative abundance of the bacteria at genus level. *P < 0.05, **P < 0.01.

