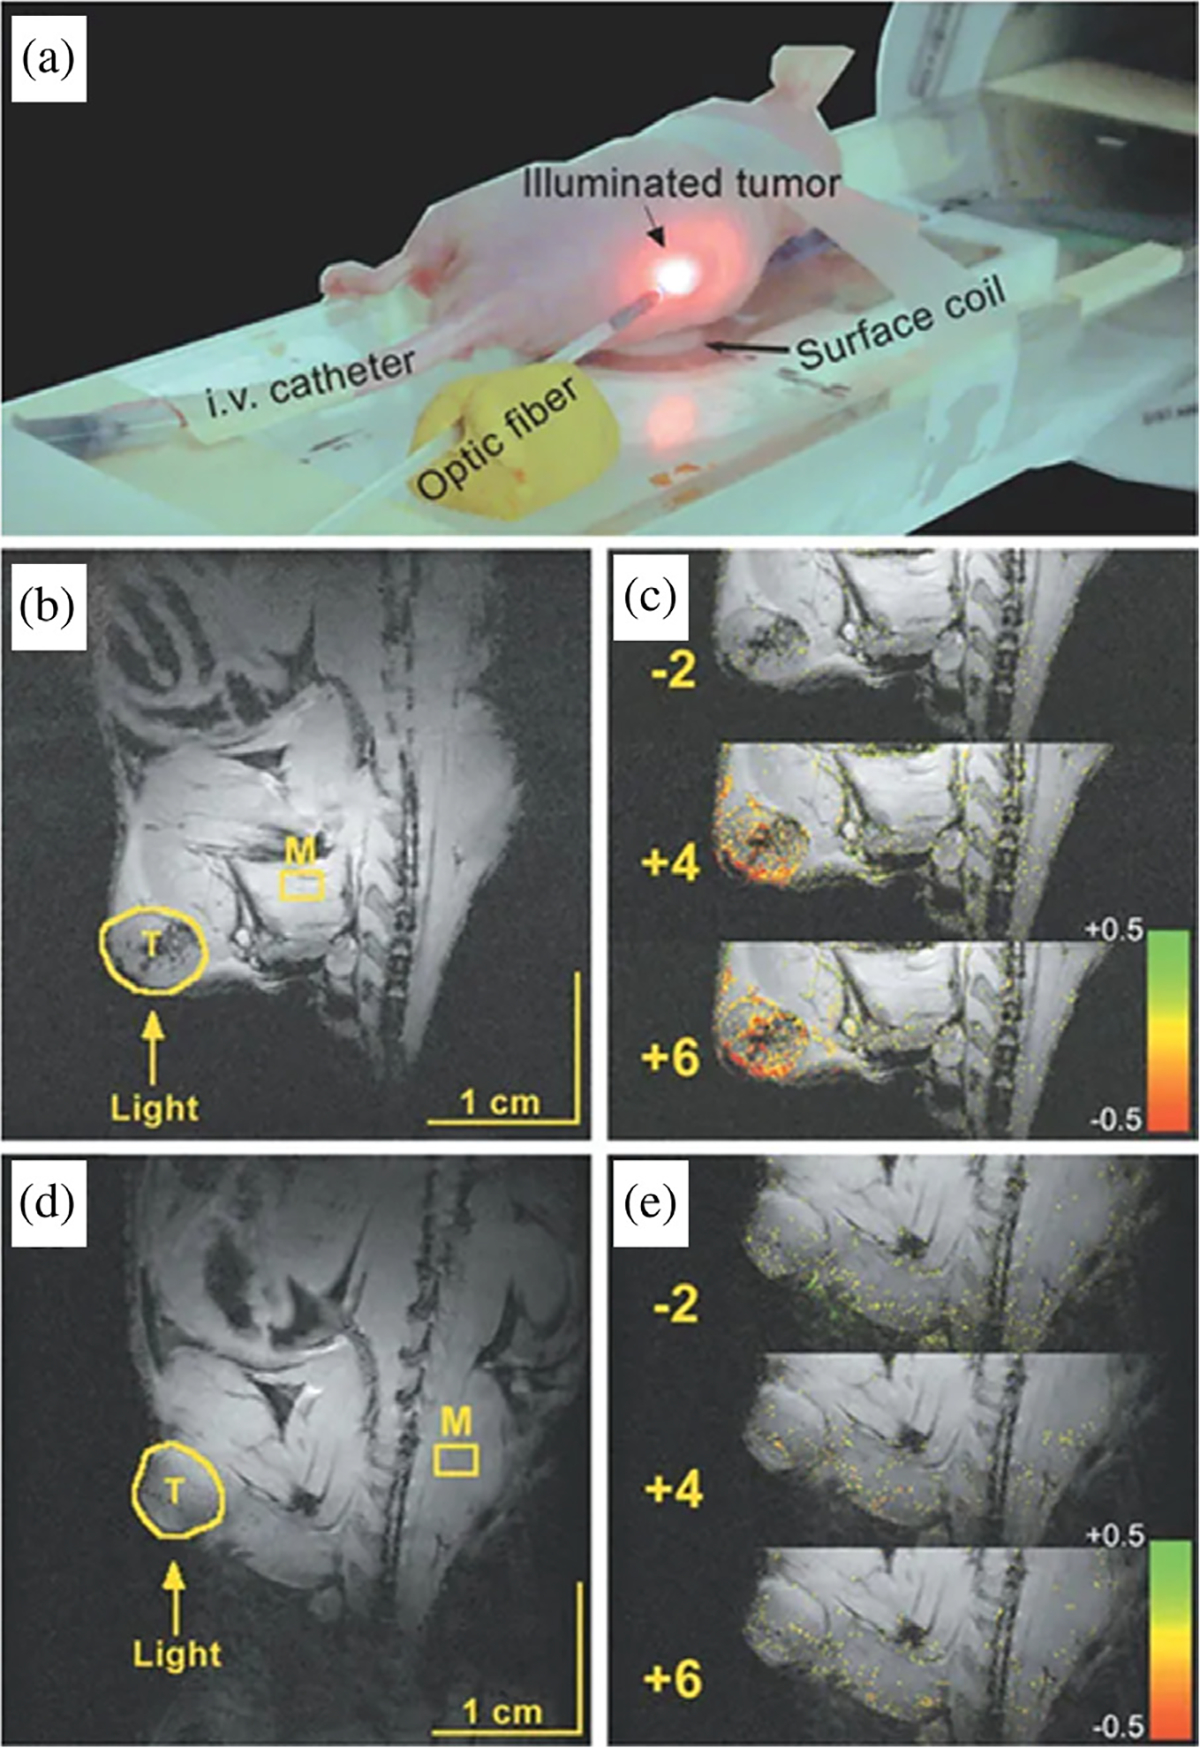
Fig. 9.

Experimental setup (a), anatomical images of pre- and post-PDT treated (b) and control (d) mice. BOLD-MRI intensity of control (c) and treated mice (e). Color coding represents ratio of signal intensity over baseline. Figure adapted from Gross et al. (2003) [251].
