-
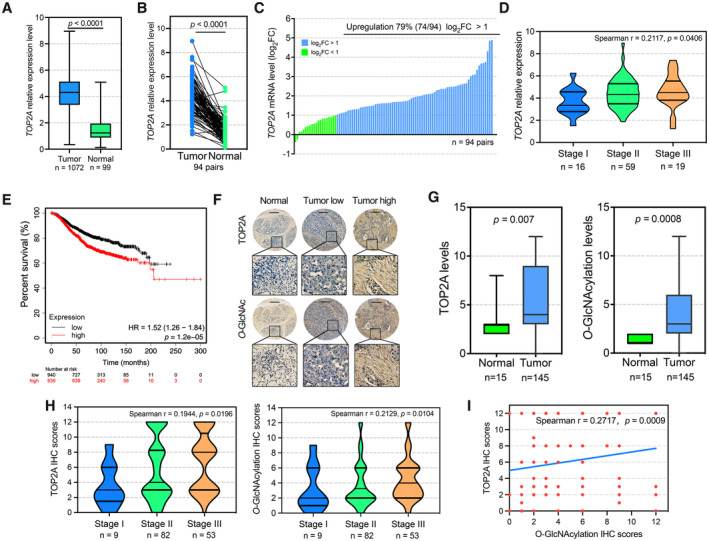
A
The mRNA expression of TOP2A in breast tumor tissue (n = 1,072 biological replicates) and normal breast tissue samples (n = 99 biological replicates) according to TCGA database. The box plots show the medians (black lines), 25th and 75th percentiles (boundaries), and minimum/maximum values (whiskers). Unpaired t‐test was used for statistical comparison. The P‐value is indicated.
-
B, C
TOP2A mRNA levels were compared between 94 pairs (biological replicates) of breast tumor tissues and their paired adjacent normal tissues from TCGA database. Wilcoxon matched‐pair signed‐rank test was used. The blue bar represents log2FC is > 1. The green bar represents that log2FC is < 1. Paired t‐test was used for statistical comparison. The P‐value is indicated. FC, fold change (tumor/normal).
-
D
Spearman correlation coefficient of TOP2A mRNA expression among different progression stages from 94 pairs (biological replicates) of TCGA breast tumor tissues. The violin plots show the 25th, 50th, and 75th percentiles. The Spearman correlation P‐value is indicated.
-
E
In TCGA breast cancer tissues, the samples with higher TOP2A mRNA levels had shorter overall survival times than those with lower TOP2A mRNA levels (n = 1879 biological replicates). Patients with TOP2A expression greater than the median are indicated by the red line, and patients with TOP2A expression below the median are indicated by the black line. HR, hazard ratio. Statistical analysis was performed by the log‐rank test. The P‐values are indicated.
-
F
Representative IHC staining of TOP2A and cellular O‐GlcNAcylation on a tissue microarray containing 145 breast tumor and 15 adjacent samples. Histological scoring was based on the positive percentages and intensity of stained cells. The micrograph scale bar represents 250 μm.
-
G
TOP2A and cellular O‐GlcNAcylation expression levels were compared between breast tumor tissues (n = 145 biological replicates) and normal adjacent tissues (n = 15 biological replicates). The box plots show the medians (black lines), 25th and 75th percentiles (boundaries), and minimum/maximum values (whiskers). Unpaired t‐test was used for statistical comparison. The P‐value is indicated.
-
H
Spearman correlation coefficient of TOP2A and cellular O‐GlcNAc expression among different progression stages from tissue microarray. The violin plots show the 25th, 50th, and 75th percentiles. One sample (Stage 0) was excluded. The Spearman correlation P‐value is indicated.
-
I
Correction analysis of TOP2A and O‐GlcNAcylation expression levels in 145 breast tumor tissues. Spearman correlation test was used. The P‐value is indicated.