-
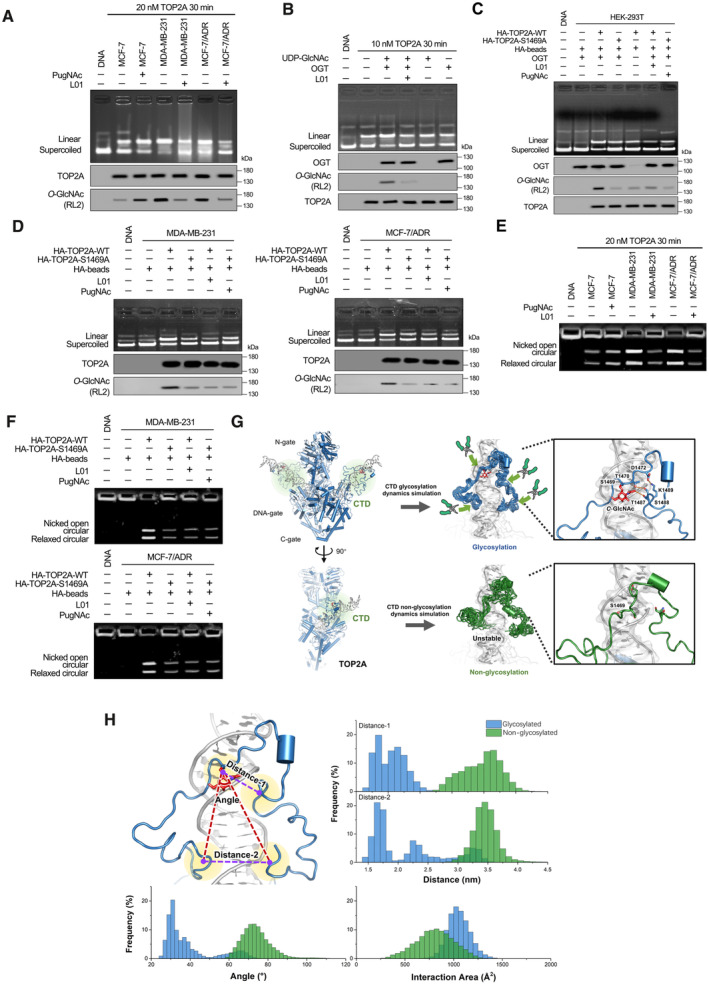
A
DNA cleavage assays were performed using TOP2A extracted (20 nM, reaction for 30 min) from breast cancer cells with 50 μM L01 or PugNAc treatment (48 h). Supercoiled pBR322 plasmid DNA was used as the TOP2A substrate. TOP2A O‐GlcNAcylation status was detected by IP.
-
B
10 nM commercially available recombinant full‐length human TOP2A was O‐GlcNAcylated by an in vitro reaction (with or without 50 μM L01, reaction for 30 min). The reaction product was then used for DNA cleavage assays and co‐IP. The immunoprecipitated fractions were analyzed by Western blot.
-
C, D
DNA cleavage assays were performed using TOP2A extracted from OGT stably overexpressed HEK‐293T cells (C) or breast cancer cells (D). These cells were stably transfected with HA‐tagged TOP2A‐WT or TOP2A‐S1469A expression plasmids and treated with 50 μM L01 or PugNAc for 48 h. TOP2A‐WT or TOP2A‐S1469A (20 nM) was immunoprecipitated using anti‐HA magnetic beads from breast cancer cells.
-
E
kDNA decatenation assays were measured using TOP2A extracted (20 nM, reaction for 30 min) from breast cancer cells with 50 μM L01 or PugNAc treatment (48 h).
-
F
kDNA decatenation assays were performed using TOP2A extracted from TOP2A‐WT or TOP2A‐S1469A overexpressed breast cancer cells with 50 μM L01 or PugNAc treatment (48 h). TOP2A‐WT or TOP2A‐S1469A (20 nM) was immunoprecipitated using anti‐HA magnetic beads from breast cancer cells.
-
G
Left: Two views of the overall model structure of TOP2A (N‐gate, DNA‐gate, C‐gate from Cryo‐EM structure 6ZY8, and CTD structure refined from Alphafold2 modeling structure with MD simulation), with the substrate DNA helix. Middle: The superposition of CTD structures from the cluster results of glycosylated (blue) and nonglycosylated (green) CTD‐DNA systems simulation trajectories. The red stick is the O‐GlcNAc group on S1469. Right: The interaction network around O‐GlcNAc moiety and S1469, act as a pivot point for the tight association with DNA by the N‐ and C‐terminal loops of CTD, which like two arms of a pincher.
-
H
The frequency of some crucial variants from 1 μs MD simulation trajectories for glycosylated (blue) and nonglycosylated (green) CTD‐DNA complex systems, which could describe the difference between these two systems. Distance‐1: center of mass distance between S1469 and 1487‐TSK‐1489. Distance‐2: center of mass distance between 1441‐TKR‐1443 and 1510‐AKS‐1512. Angle: the angle is formed with the center of mass of S1469 as the vertex, and two vectors from the vertex to the center of mass of 1441‐TKR‐1443 and 1510‐AKS‐1512 as the edges. Interaction area: area of the interaction between CTD and DNA.

