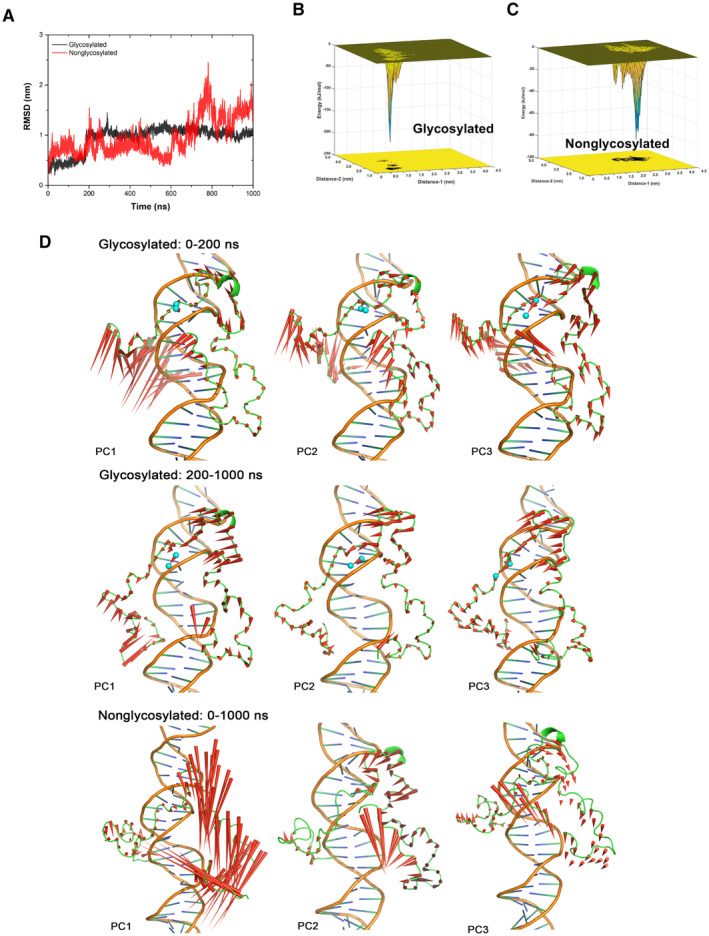
Figure EV5. Molecular simulation of O‐GlcNAcylated TOP2A CTD with DNA.

-
AThe curves of root‐mean‐square deviation of CTD Cα atoms along with the time traces from the trajectories of glycosylated and nonglycosylated CTD‐DNA systems. The fluctuation of glycosylated CTD‐DNA system's RMSD was smaller than nonglycosylated system and became steady around 1 nm after 200 ns MD simulation.
-
B, CThe conformational energy surface of glycosylated (B) and nonglycosylated CTD‐DNA systems (C). The energy surface was computed as a function of Distance‐1 (center of mass distance between S1469 and 1487‐TSK‐1489, to indicate the distance between GlcNAc group and adjacent residues) in nm and Distance‐2 (center of mass distance between 1441‐TKR‐1443 and 1510‐AKS‐1512, to indicate the distance between two terminals of CTD) in nm against the overall 1 μs trajectory of each system. Isosurfaces were shown every 1 kJ/mol. There are several small ensemble states and one dominate ensemble state in the energy surface of glycosylated CTD‐DNA system that the deepest energy minimum corresponds to Distance‐1 about 0.8 nm, Distance‐2 about 1.5 nm and energy about −225 kJ/mol. Three consecutive energy minimums in the energy surface of nonglycosylated CTD‐DNA system, as shown in Fig 4G, correspond to Distance‐1 from 1.5 to 2.5 nm, and Distance‐2 around 3.3 nm with energy worse than −90 kJ/mol. This result indicated that glycosylated S1469 enables a tighter conformation ensemble and significantly stabilizes the association between CTD and DNA. Distance‐1: center of mass distance between S1469 and 1487‐TSK‐1489. Distance‐2: center of mass distance between 1441‐TKR‐1443 and 1510‐AKS‐1512.
-
DThe difference in protein motion between the first 200 ns and the rest 800 ns simulation of glycosylated CTD‐DNA system was obvious from the PCA analysis. The protein is quite dynamic, especially the N‐terminal of CTD in the first 200 ns simulation. The interaction network around the glycosylation S1469 (the GlcNAc group shown as cyan sphere) gave the N‐terminal loop (residue 1,435–1,450) enough time to close and enter the major groove of DNA that polar and charged sidechain residues (K1439, 1441‐TKRD‐1444) in this loop could make strong interactions with DNA. The protein dynamics were more stable in the rest 800 ns trajectory. In contrast, the movement in nonglycosylated system was enormous and inhomogeneous in different regions. The residues around S1469 performed strong tendency to move away from DNA, which was unbeneficial for the stable interaction.
Source data are available online for this figure.
