
Extended Data Figure 7. Live imaging of the inheritance of EBNA1 foci through cell division.
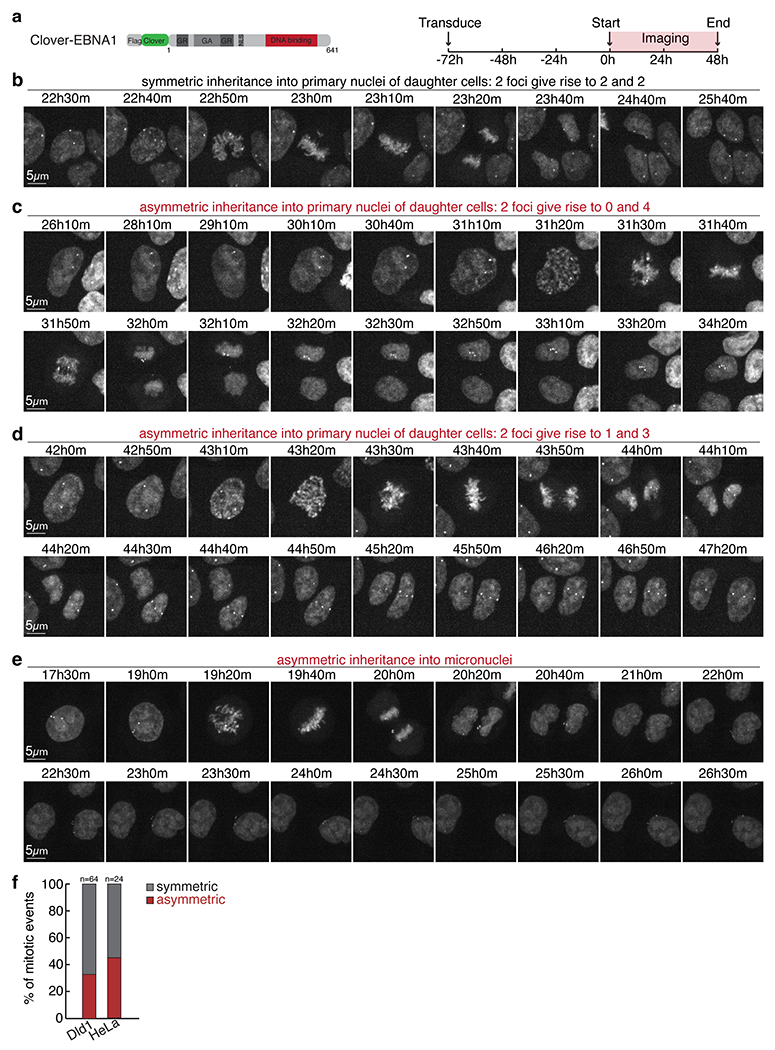
(a) Schematic of the clover-tagged allele of EBNA1 used for live-imaging at 10min intervals for 48 hours starting at day 3 following transduced expression in Dld1s or HeLas. Still images capturing either symmetric inheritance (b) or asymmetric inheritance of EBNA1 foci into primary nuclei (c-d) or micronuclei (e) of daughter cells as quantified in (f). 64 mitotic events were scored for DLD1 cells, 24 mitotic events for HeLa cells.