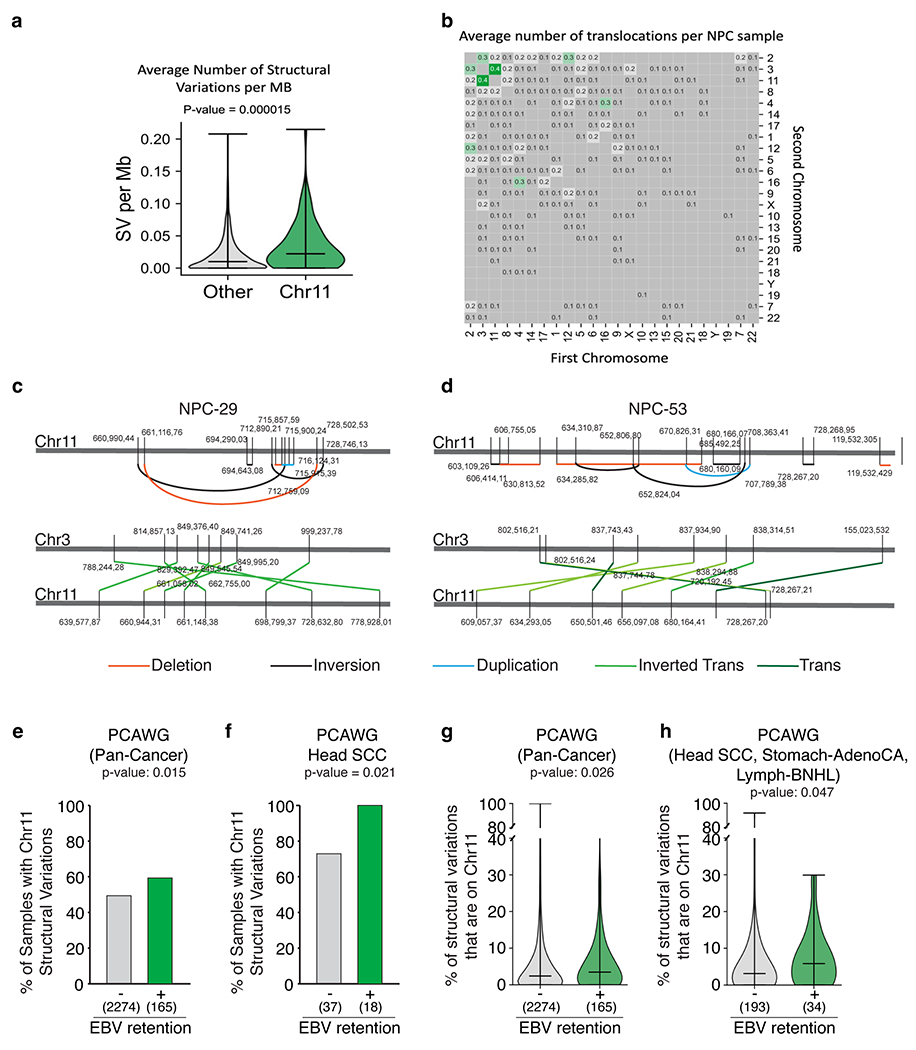
Extended Data Figure 15. Prevalence of chromosome 11 structural variations across EBV-infected Nasopharyngeal Carcinoma (NPC) and Pan-Cancer Analysis of Whole Genomes (PCAWG).

Average number of structural variations (SV) per Mb (a) and translocations (b) of n=78 EBV-infected NPC genomes. Bars represent the minimum, median and the maximum values observed in each violin plot (Two-sided Mann-Whitney U rank test, P-value is indicated, not corrected for multiple hypothesis testing). (c-d) Schematic of clustered structural variations (deletions, inversions, duplications, inverted translocations) on chromosome 11 in NPC genomes. (e-f) Proportion of samples with or without detectable EBV that harbor at least two chromosome 11 structural variations (Two-sided Fisher’s exact test, p-value is indicated, not corrected for multiple hypothesis testing; corrected p-values are 0.08 for pan-cancer and 0.05 for Head-SCC). (g-h) Proportion of structural variations (SV) that are on chromosome 11 in samples with or without detectable EBV. Bars represent the minimum, median and the maximum values observed in each violin plot (Two-sided Mann-Whitney U rank test. P-value is indicated, not corrected for multiple hypothesis testing).
