
Fig. 4 |. Elevated abundance of EBNA1 triggers 11q23 breakage and micronucleation in cells latently infected with EBV.
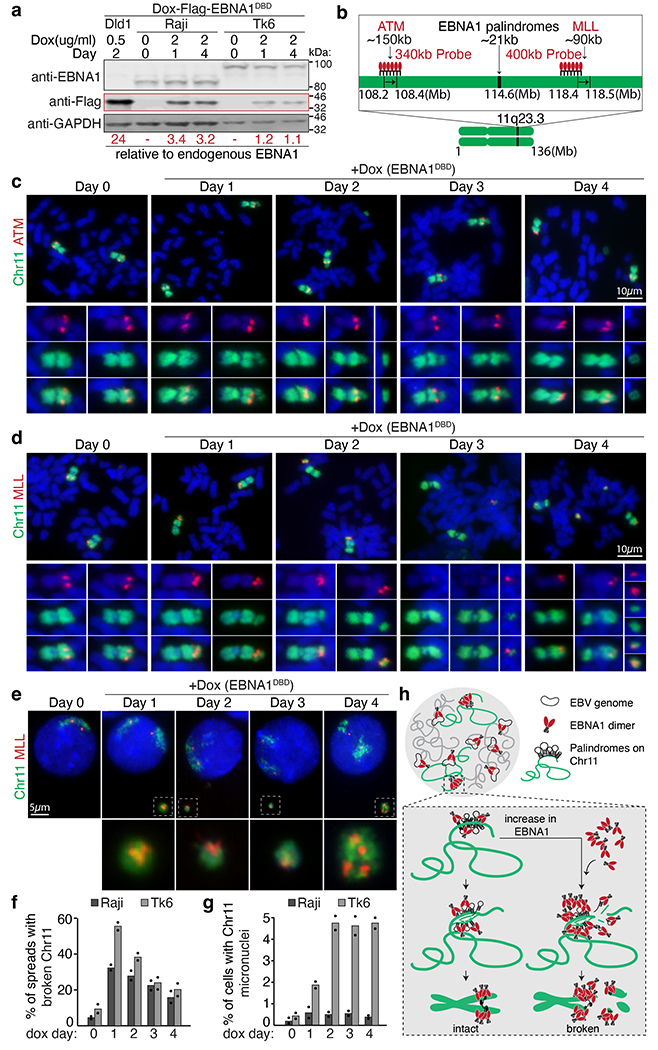
a, Representative immunoblots of Raji cells and TK6 cells expressing Flag–EBNA1(DBD) at day 0, 1 and 4. Numbers under the blots indicate levels of Dox-induced Flag-EBNA1(DBD) relative to endogenous EBNA1, calculated using Dox-induced Flag–EBNA1(DBD) in DLD1 cells previously determined to be 24-fold (Extended Data Fig. 13). A total of 1.5 Å~ 105 Raji or TK6 cells and 1.0 Å~ 105 DLD1 cells were loaded in each lane. Immunoblot was carried out three times, with standard deviations below 10%. For gel source data, see Supplementary Fig. 1. b, Schematic of dualcoloured FISH using a BAC probe against whole chromosome 11 (green) and a BAC probe (in red) against either ATM or MLL. c,d, Representative FISH images showing breakage of chromosome 11 distal to ATM (c) or proximal to MLL (d). Scale bars, 10 μm. e, Representative FISH images showing micronucleation of MLL-containing chromosome 11 fragments. Scale bar, 5 μm. f, Quantification of the frequency of 11q23 breakage. For Raji cells, 105 mitotic spreads were counted on day 0, 122 on day 1, 107 on day 2, 98 on day 3, and 98 on day 4. For TK6 cells, 109 mitotic spreads were counted on day 0, 90 on day 1, 162 on day 2, 81 on day 3, and 67 on day 4. Data are presented as bars representing mean values from two independent experiments. g, Quantification of the frequency of micronucleation. For Raji cells, 700 cells were counted on day 0, 801 on day 1, 905 on day 2, 510 on day 3, and 810 on day 4. For TK6 cells, 1,840 cells were counted on day 0, 646 on day 1, 676 on day 2, 738 on day 3, and 632 on day 4. Data are presented as bars representing mean values from two independent experiments. h, Schematic of the proposed role of EBNA1.