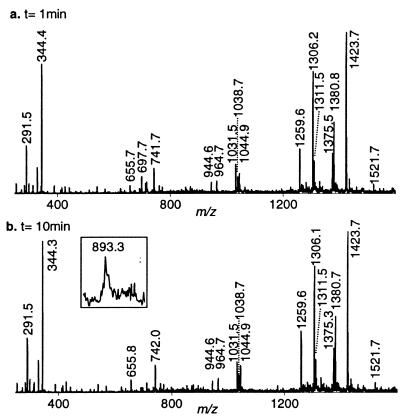
Figure 7.
Degradation of 2 by activated Fe–BLM. Full scan ESI MS analysis. (a) Recorded MS spectrum of the quenched reaction mixture. The non-covalent Fe–BLM/2 complex was destroyed by addition of acidified EDTA after 1 min. (b) The full scan MS spectrum shows the quenched reaction mixture after 10 min. The unquenched reaction (full scan not shown) yielded maximum abundance of the doubly cleaved fragment 12 (m/z = 893.3) (see inset). Identified cleavage products are listed in Table 2.

