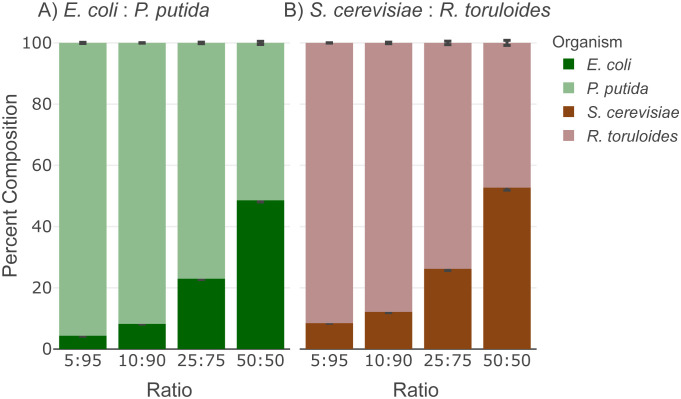
Fig 2. Community proteomic composition analysis of mock mixtures shows accurate estimation of biomass contribution.
The stacked bar plots display the percentage of biomass contribution from members in (A) Gram-negative mock community, and (B) Non-filamentous fungi mock community. The error bar shows the standard deviation of calculated composition of each member (n = 4). The LCMS analysis raw data have been deposited to the ProteomeXchange Consortium data depository at http://www.proteomexchange.org/. They are publicly accessible with the dataset identifier PXD039268.

