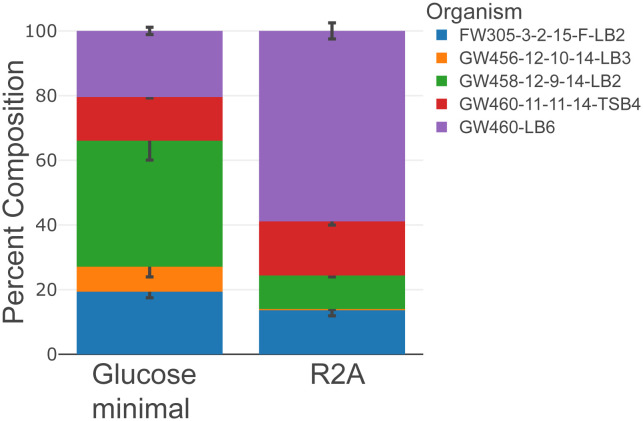
Fig 3. Community proteomic composition analysis shows accurate estimation of biomass contribution of community structure changes upon different culture conditions.
The stacked bar plots display the percentage of biomass contribution from members of the synthetic microbial community, and the error bars show the standard deviation of calculated composition of each member (n = 3). Synthetic microbial community shows distinct structure when culturing in different media, Reasoner’s 2A (R2A) and glucose minimal medium. The LCMS analysis raw data have been deposited to the ProteomeXchange Consortium data depository at http://www.proteomexchange.org/. They are publicly accessible with the dataset identifier PXD039268.

