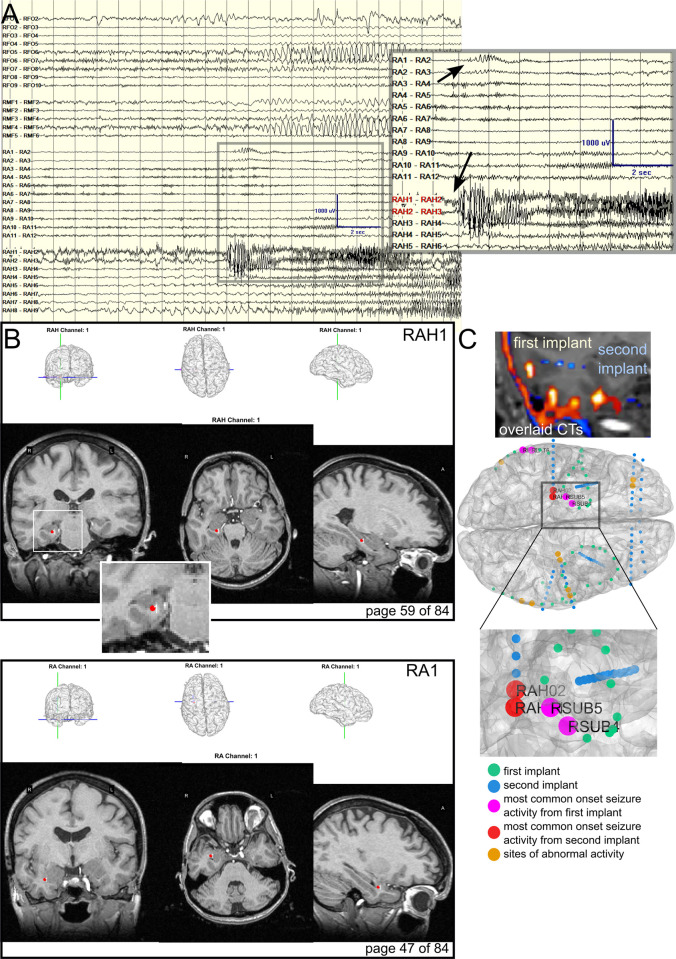
Fig 2. Electrode localization for mapping seizure onset zones across successive implants.
A. The clinical sEEG recording during seizure onset during the second implant, shown here for comparison’s sake. Zoomed image shows the onset of seizure at the channels displayed in panel B (RAH and RA). B. Example pipeline output images showing RAH and RA electrode locations relative to three views of the structural pre-op MRI. C. How the pipeline can be used clinically to compare electrode placements between old and new implantations on the same patient, including sites which exhibited abnormal activity most frequently per implant period preceding a seizure. Top: First and second postoperative CTs overlaid on the most recent MRI showing different electrode locations. Blue/cyan is the second implant while red/yellow is the first implant. Bottom: Previously implanted electrodes are green, and the new electrodes are shown in blue. Sites which showed seizures onsets during the first implant period are magenta and during the second implant period are red. Visualizing implanted electrode locations in the structural MRI.

