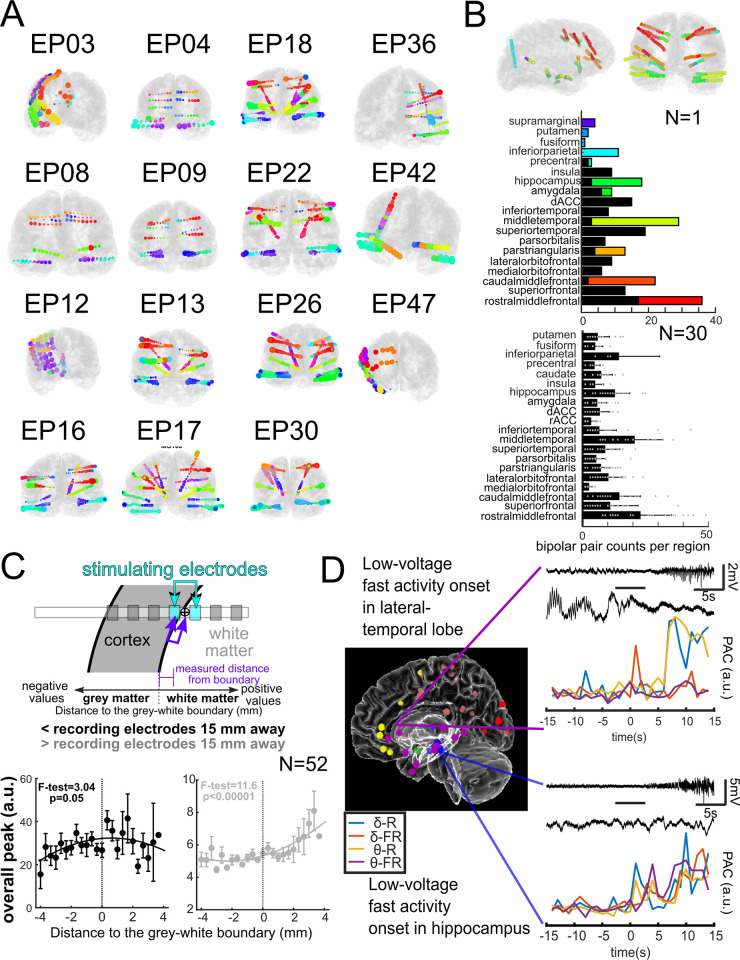
Fig 5. Pipeline research use cases for stimulation and seizure onset.
A. Electrode localization and labelling across patients. The color coding indicates common labels across participants (designated EPXX) for implanted leads. B. The pipeline allows automatic identification of electrode coverage across patients per brain label. Contact counts for different brain regions in individual participant (top) and across multiple participants (bottom, N = 30). C. Demonstration of how stimulation electrode location relative to the grey-white boundary can affect responses in local contacts (less than 15 mm away) and in distant contacts (greater than 15 mm; [14]). D. Electrode labeling algorithm (ELA) used to determine the location of electrodes during seizure onset (colored dots represent seizure onsets). Using ELA output, phase-amplitude coupling was analyzed and found to have different dynamics in different brain regions. δ: Delta; θ: Theta; R: Ripple; FR: Fast ripple; PAC: Phase-amplitude coupling; a.u.: Arbitrary unit [6].

