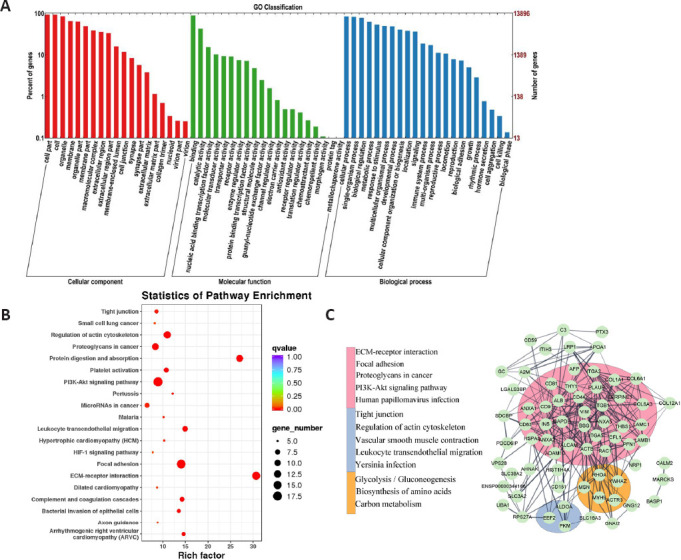
Figure 7.

MiRNA sequencing, protein spectrum sequencing, and bioinformatics analysis of Exos.
(A) GO annotation of miRNA target genes. (B) Bubble chart of KEGG analysis of the top 100 proteins. (C) PPI network constructed from the top 100 proteins. Nodes represented proteins, lines represented correlation, different colors represented different subsets, and the bar on the left side shows the top five pathways in each subset identified by the KEGG enrichment analysis. Exos: Exosomes; GO: Gene Ontology; KEGG: Kyoto Encyclopedia of Genes and Genomes; miRNA: microRNAs; PPI: protein protein interaction.
