Figure 3.

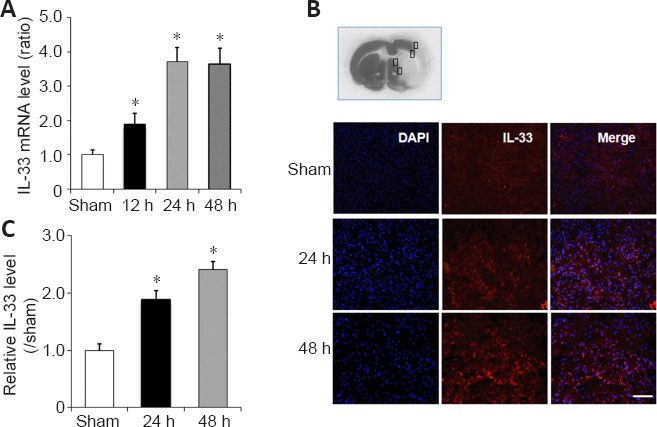
IL-33 expression level in the peri-infarct penumbra of mice with ischemic stroke.
(A) RT-PCR results of Il-33 mRNA levels (normalized by levels in the sham group) in peri-infarct penumbra. (B) Representative immunofluorescence images of IL-33 (red) in the peri-infarct penumbra (corresponding to the box in the upper image). Nuclei were stained with DAPI (in blue). Immunofluorescence labeling revealed substantial IL-33 expression in the peri-infarct penumbra of mice 24 and 48 hours after reperfusion. Scale bar: 50 µm. (C) Quantitative analysis of immunofluorescence staining for IL-33 (normalized by levels in the sham group) in B. All values are expressed as mean ± SD (n = 5 for each group). *P < 0.05, vs. sham group (one-way analysis of variance followed by the Tukey’s post hoc test). DAPI: 4′,6-Diamidino-2-phenylindole; IL-33: interleukin-33; RT-PCR: reverse transcription-polymerase chain reaction.
