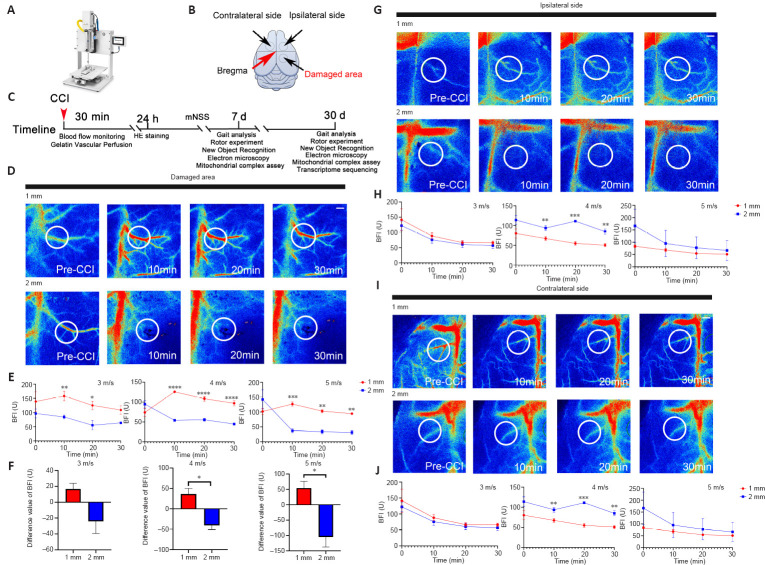
Figure 1.
Changes of cerebral blood perfusion within 30 minutes of CCI model establishment detected by laser speckle imaging.
(A) Schematic diagram of the equipment used in CCI modeling. (B) Schematic diagram of the injury area, region ipsilateral to the injury area, and region contralateral to the injury area. (C) Timeline of the mouse CCI modeling and experimental workflow. (D) Representative images of BFI changes in the damaged area 10, 20, and 30 minutes after injury. The white circle indicates the main detection range. (E) Statistical analysis of BFI changes in the damaged area 10, 20, and 30 minutes after injury (n = 3 mice in each group). (F) Changes of blood flow in the injured area 10 minutes after injury compared with the baseline (cerebral blood flow before injury) (n = 3 mice in each group). (G) Representative images of BFI changes 10, 20, and 30 minutes after injury ipsilateral to the injury area. The white circle is the main detection range. (H) Statistical analysis of BFI changes in the area on ipsilateral to the injury area, 10, 20, and 30 minutes after injury (n = 3 mice in each group). (I) Representative images of BFI changes 10, 20, and 30 minutes after injury in the area on contralateral to the injury area. The white circle indicates the main detection range. (J) Statistical analysis of BFI changes in the area on contralateral to the injury area 10, 20, and 30 minutes after injury. n = 3 mice in each group. Data are presented as mean ± SEM. *P < 0.05, **P < 0.01, ***P < 0.001, ****P < 0.0001 (repeated measures analysis of variance for E, H, J; two-tailed unpaired t-test for F). BFI: Blood flow index; CCI: controlled cortical impingement; HE: hematoxylin and eosin; mNSS: modified neurological severity score.

