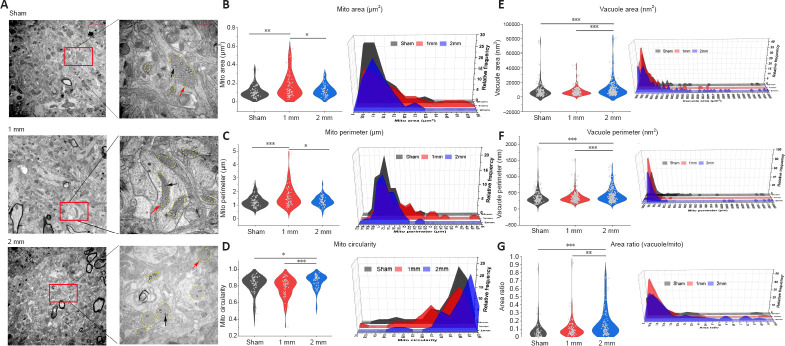
Figure 8.
Electron microscopic results of mitochondria and vacuoles in the damaged area of 1 and 2 mm groups on day 30.
(A) Mitochondria and mitochondrial vacuoles in the injured brain tissue of the Sham group, the 1 mm group, and the 2 mm group. The red arrow indicates mitochondria, and the black arrow indicates vacuoles. Compared with mitochondria in the Sham group and 2 mm group, mitochondria in 1 mm group were larger. Compared with mitochondria in the Sham group and 1 mm group, mitochondria in the 2 mm group became round and vacuoles became larger. Scale bars: 2 µm and 500 nm in the enlarged images. (B–D) Violin statistics and frequency distribution of mitochondrial area (B), mitochondrial perimeter (C), and mitochondrial circularity (D). Sham group n = 76, 1 mm group n = 68, 2 mm group n = 64. (E–G) Violin diagram and frequency distribution of vacuolar area (E), vacuolar perimeter (F), and vacuolar/mitochondrial area ratio (G). Sham group n = 189, 1 mm group n = 221, 2 mm group n = 217. n = 3 mice in each group. Data are expressed as mean ± SEM. *P < 0.05, **P < 0.01, ***P < 0.001 (Kruskal-Wallis H test and Nemenyi multiple comparisons test).

