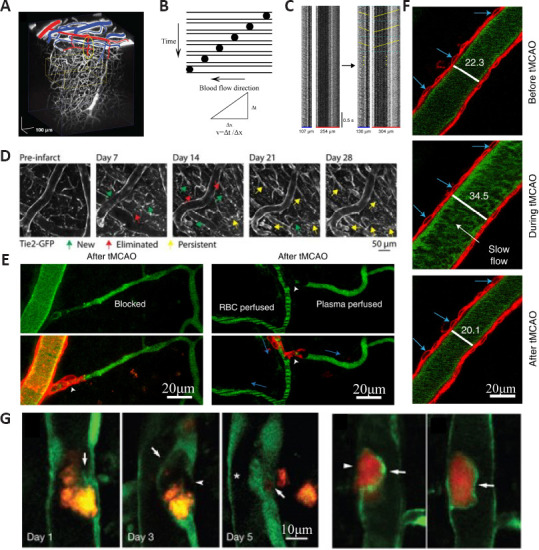
Figure 3.

Vessels observed by 2PLSM.
(A) Reconstructing the 3D network structure of blood arteries in the cortex from in vivo 2PLSM. Surface arterioles are marked in red and venules are marked in blue. Yellow ovals indicate the target penetrating arteriole. (B) Intravenous injection of fluorescent dyes to label blood plasma and measure blood flow velocity using high-speed line-scan technique. The fluorescent-labeled blood plasma is bright, and red blood cells are dark, represented by dark dots. Red blood cells flow within the vessel following the blood flow direction and form diagonal streaks. Calculating the slopes of the streaks can obtain the blood flow velocity. (C) Kymographs of the same vessels after nonlinear transformation so that the horizontal axis represents 3D distance. For flow speed measurement, each kymograph was divided into 0.5-second blocks (cyan dashed lines). (D) The recovery process of vessels from photothrombotic stroke (PT) in Tie2-GFP transgenic mice. (E) Real images obtained from in vivo 2PLSM in transgenic mice labeling mural cells after transient middle cerebral artery occlusion (tMCAO). This image shows the flow outcome of an arteriole and its downstream capillary after tMCAO. (F) Example image showing an arteriole before, during, and after tMCAO (blue arrows indicate the same vascular smooth muscle cells; numbers indicate vessel diameter). Scale bar, 20 µm. (G) Real images for embolus extravasation obtained from in vivo 2PLSM. 2PLSM: Two photon-excited fluorescence laser-scanning microscopy; GFP: green fluorescent protein. A is reprinted from Nishimura et al. (2010) with permission. C–G are reprinted from Fan et al. (2020), Williamson et al., (2020), Hill et al. (2015), Tong et al. (2021), and Lam et al. (2010) with permission, respectively.
