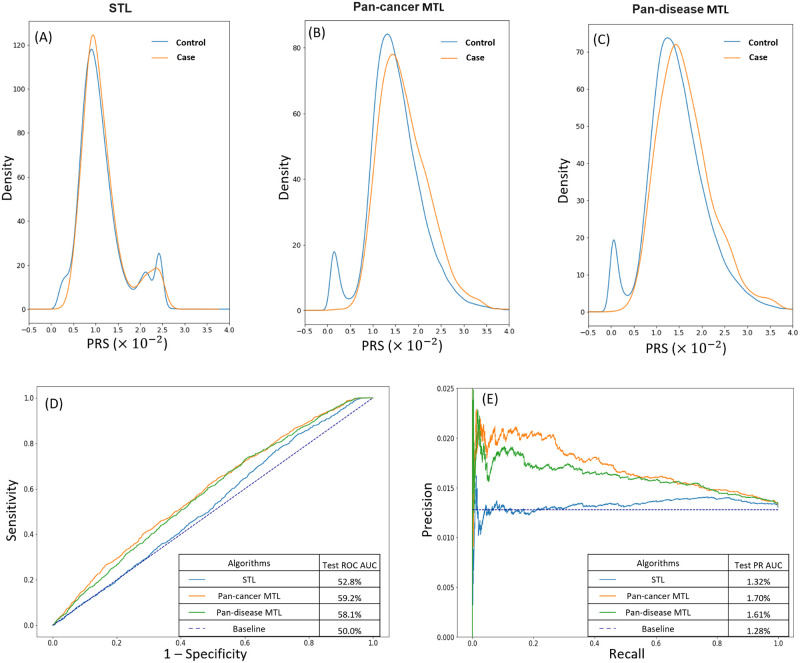
Fig 2. PRS estimation for malignant melanoma by STL and MTL.
(A–C) Density plots of malignment melanoma PRS estimated by (A) STL, (B) pan-cancer MTL, and (C) pan-disease MTL. Each panel contains two overlapping density plots: a blue one for the control test cohort and an orange one for the case test cohort. The separation between the control and case density plots is greater in the two MTL panels than in the STL panel. (D) Receiver operating characteristic (ROC) curves of STL (blue), pan-cancer MTL (orange), and pan-disease MTL (green) for malignant melanoma PRS with the baseline (indigo dotted line). Both pan-cancer MTL and pan-disease MTL have larger ROC AUC than STL. (E) Precision-recall (PR) curves of STL (blue), pan-cancer MTL (orange), and pan-disease MTL (green) for malignant melanoma PRS with the disease prevalence as the baseline (indigo dotted line). The two MTL models also have larger PR AUC than STL.

