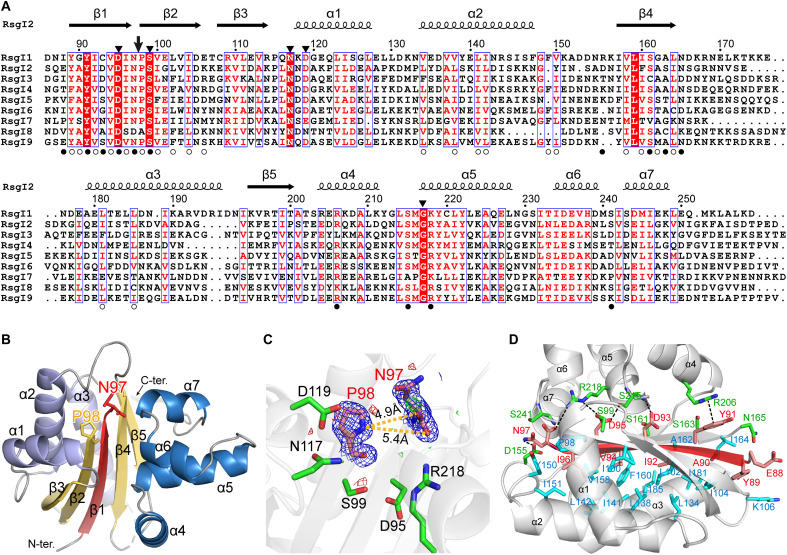
Fig. 2. Structure of RsgI2-PD.
(A) Sequence alignments of the RsgI-PDs from C. thermocellum. The autocleavage site and the surrounding conserved residues are indicated by an arrow and filled triangles, respectively, at the top. The residues involved in the polar and hydrophobic interactions between the disconnected β1 and the other parts of the protein are indicated by filled and open circles, respectively, at the bottom. (B) Ribbon representation of the crystal structure of RsgI2-PD. The disconnected β1 caused by the autocleavage is colored in red, and residues Asn97 and Pro98 are shown as sticks. (C) The conserved residues around the Asn97 and Pro98. The 2mFo-DFc densities for Asn97 and Pro98 are contoured in blue at 1.0σ. The mFo-DFc maps are shown in green and red for positive and negative densities, respectively, at 3.0σ. (D) The interactions of β1 with other parts of the protein. The residues of α helix subdomains involved in the polar and hydrophobic interactions are shown as green and cyan sticks, respectively.

