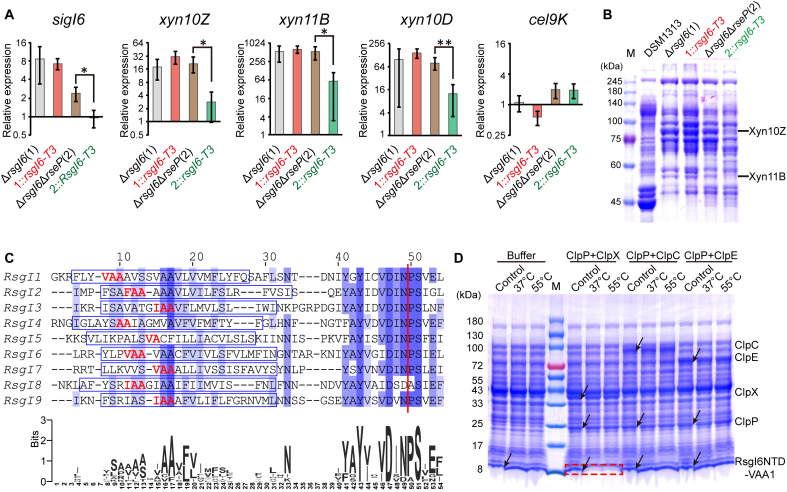
Fig. 5. The role of RseP and ClpXP in the signal transduction of RsgI6.
(A) qRT-PCR analysis of SigI6 and xylanase expression in ΔrsgI6, ΔrsgI6ΔrseP, and their rsgI6-T3-complemented strains. The relative expression represents the ratio of the mRNA levels in the mutant strains compared to that of the wild-type DSM1313 strain. The P values were calculated on the basis of three replicates using Student’s t test between ΔrsgI6ΔrseP and ΔrsgI6ΔrseP::rsgI6-T3. *P < 0.05 and **P < 0.01. (B) SDS-PAGE analysis of the extracellular proteins of ΔrsgI6, ΔrsgI6ΔrseP, and their rsgI6-T3–complemented strains cultured with cellobiose as the carbon source. (C) Sequence alignment of the transmembrane helix regions of the RsgIs in C. thermocellum. The transmembrane helices predicted by TMHMM (65) are indicated by blue rectangles. A consensus WebLogo (66) is shown at the bottom. The red vertical line indicates the Asn-Pro cleavage site. The potential ClpP recognition motifs are colored in red. (D) Protease assay using RsgI6NTD-VAA1 as the substrate. The positions of the proteases and substrates in the control (the mixture before the reaction) are indicated by arrows. The degradation of substrate bands is indicated by a red dashed rectangle.

