FIGURE.

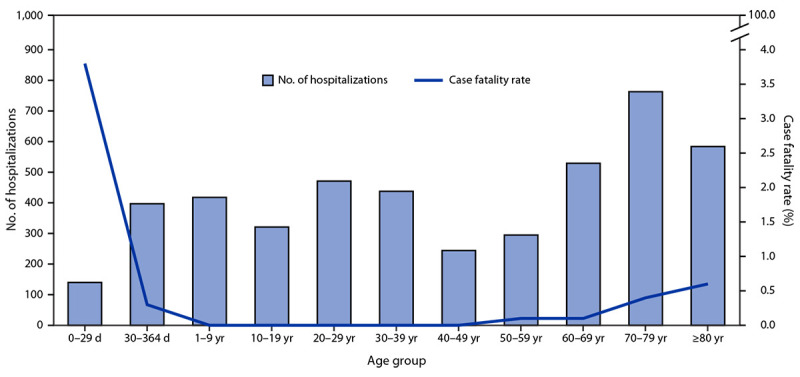
Number of hospitalizations (N = 4,604) and case fatality rate* among probable and confirmed chikungunya cases, by age group — Paraguay, October 1, 2022–March 11, 2023
* Deaths per 100 cases.

Number of hospitalizations (N = 4,604) and case fatality rate* among probable and confirmed chikungunya cases, by age group — Paraguay, October 1, 2022–March 11, 2023
* Deaths per 100 cases.