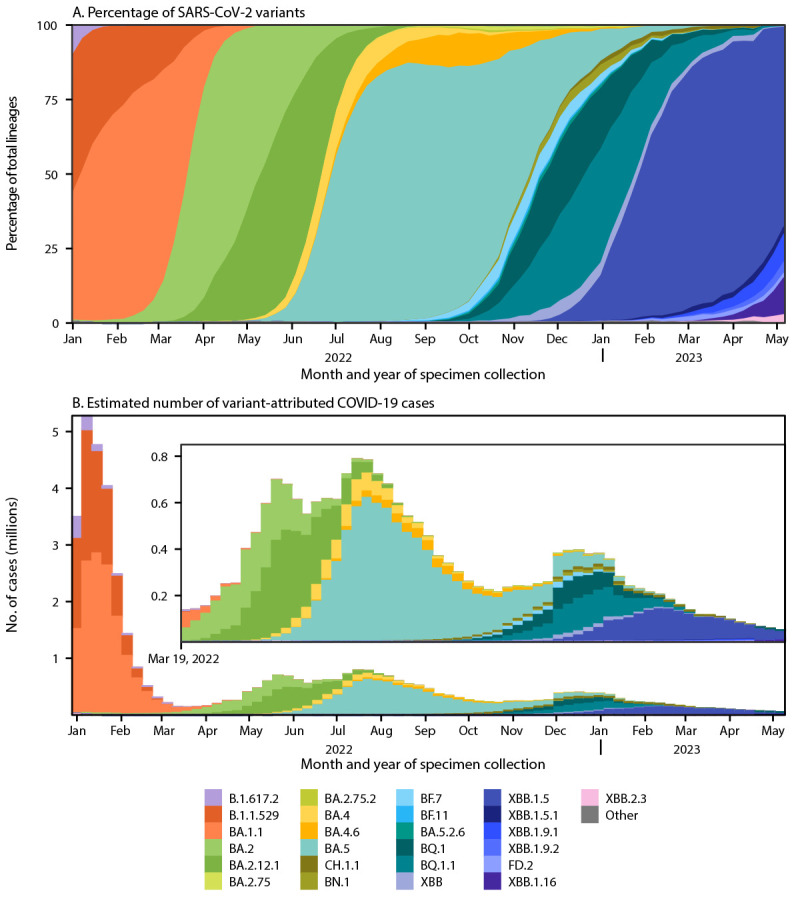
FIGURE 1.

National estimates of weekly proportions* of SARS-CoV-2 variants† (A) and estimated number of variant-attributed cases§ (B) — United States, January 2, 2022–May 13, 2023
Abbreviations: CELR = COVID-19 electronic laboratory reporting; NS3 = National SARS-CoV-2 Strain Surveillance Program.
* Sequences are reported to CDC through NS3, contract laboratories, public health laboratories, and other U.S. institutions. Variant proportion estimation methods use a complex survey design and statistical weights to account for the probability that a specimen is sequenced. https://covid.cdc.gov/covid-data-tracker/#variant-proportions
† Lineages reaching a prevalence of ≥1% with spike protein substitutions of potential therapeutic relevance and separated out on the COVID Data Tracker website.
§ Estimated numbers of COVID-19 cases attributable to variants were calculated by multiplying weekly numbers of reported positive nucleic acid amplification tests from CELR with estimated variant proportions.
