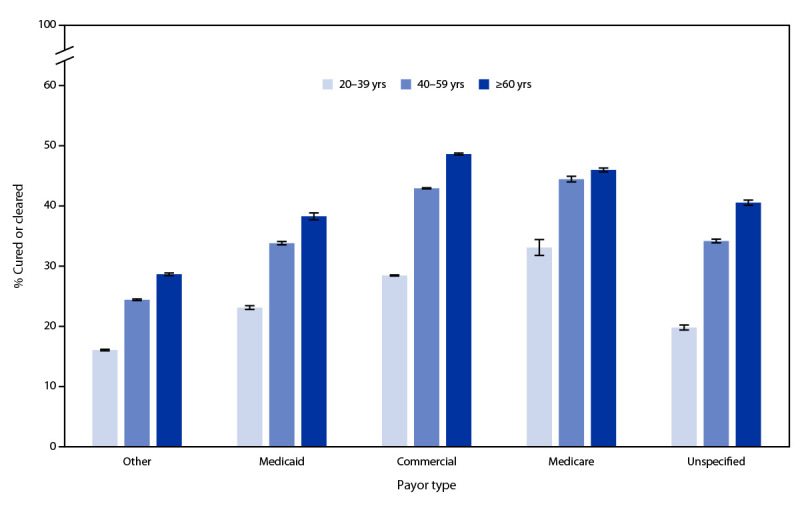
FIGURE 2.

Proportion* of hepatitis C virus–infected persons with evidence of viral clearance, by age group† and payor type§ — United States, 2013–2022¶
Source: Quest Diagnostics (January 1, 2013–December 31, 2022).
* With 95% CIs indicated by error bars.
† Persons aged 0–19 years were not included because of small sample sizes.
§ Other payor includes client or self-pay, and unspecified includes persons with no payor type provided in the record.
¶ Includes all persons with initial infection during January 1, 2013–December 31, 2022.
