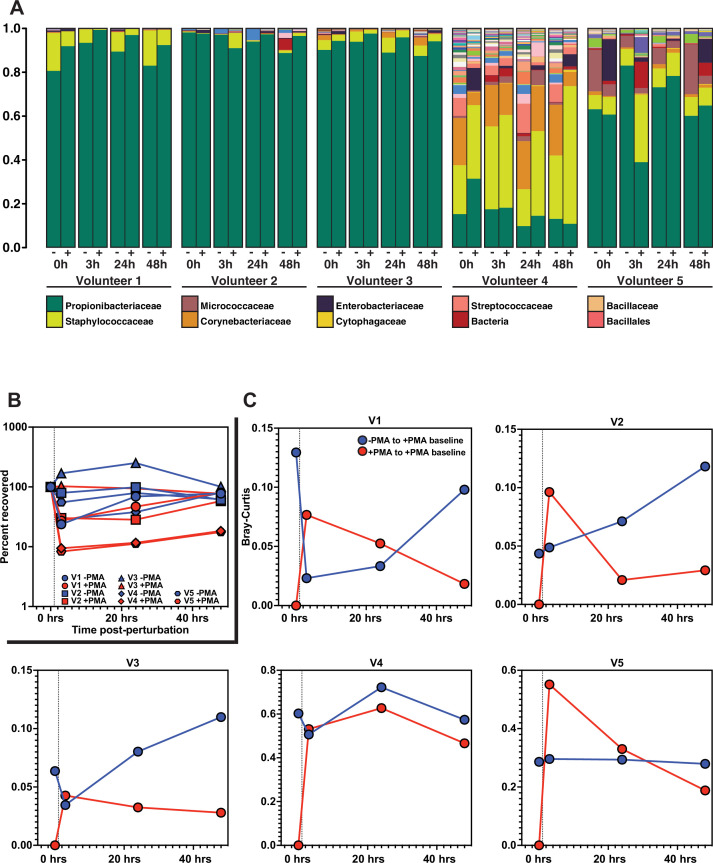
Figure 6. Skin microbiome perturbation and recovery.
(A) Bacterial relative abundance in each individual over the 48 hr following perturbation. 0 hr represents baseline, pre-perturbation community. Whether a sample was treated with propidium monoazide (PMA) is indicated by (-) and (+). (B) Quantification of bacterial DNA recovery over the 48 hr following perturbation. DNA was quantified using droplet digital PCR (ddPCR). (C) Bray–Curtis dissimilarity of each individual over the 48 hr following perturbation. Red data points are comparing PMA-treated samples to the PMA-treated baseline sample. Blue data points are comparing PMA-untreated samples to the PMA-treated baseline sample. Dashed vertical line indicates the point of perturbation.


