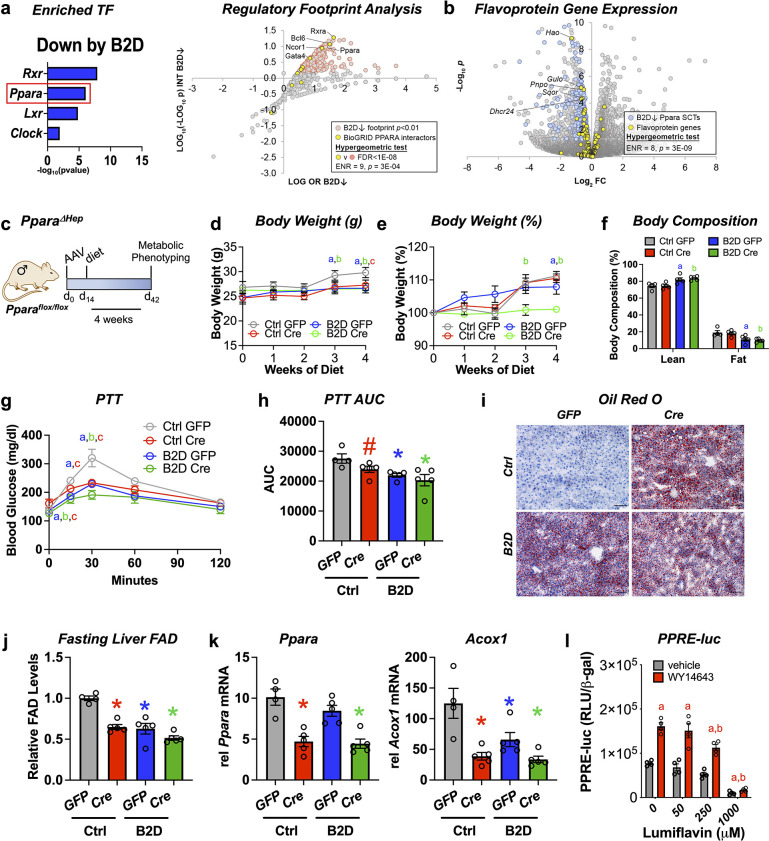
Figure 3. Liver PPARα governs glucogenic responses to dietary riboflavin.
(a) Top enriched, vitamin B2-deficient diet (B2D) repressed gene sets using the EnrichR transcription factor collection (left). Scatterplot showing enrichment of known BioGRID-curated PPARα interacting nodes (yellow) among nodes with the most significant intersections with B2D-repressed genes (right). (b) Volcano plot depicting expression levels of PPARα-regulated flavoprotein genes (yellow) after Ctrl or B2D. (c) One-month-old Pparaflox/flox male mice (n = 4–5 per group) received either AAV-TBG-GFP or AAV-TBG-Cre. Two weeks later, mice were provided 99% B2D or isocaloric diet (Ctrl) for 1 mo. (d) Body weight (g), (e) % body weight gain and (f) body composition (% of body mass). (g) Blood glucose levels and (h) area under the curve (AUC) during pyruvate tolerance tests. (i) Representative Oil-Red-O stained liver sections after B2D, scale bar 100 μm. (j) Flavin adenine dinucleotide (FAD) concentrations in the fasted liver after 4 wk of B2D. (k) Relative mRNA expression of Ppara and Acox1. Tbp served as the invariant control. (l) HepG2 cells were transiently transfected with a PPARα expression plasmid. PPRE luciferase reporter activity was measured in response to PPARα agonist (WY-14643) ± lumiflavin and normalized to β-galactosidase (n = 4). Statistics: *p<0.05 vs. control GFP (a, B2D GFP; b, B2D Cre; c, Ctrl Cre) by two-way ANOVA with Fisher LSD (d, e, g), *p<0.05 for body composition (fat and lean mass%) by Mann–Whitney vs. control GFP, *p<0.05, #p<0.10 vs. control GFP by one-way ANOVA with Dunnet’s test and Fisher LSD (h, j, k). *p<0.05 by two-way ANOVA with Tukey’s multiple-comparison test for (l), a and b are statistical differences vs. vehicle and WY-14643, respectively. Statistical enrichment shown by hypergeometric test (a, right, b). Data are mean ± SEM. Numerical data for individual panels are provided in Figure 3—source data 1.


