. 2023 Jul 7;12:e84077. doi: 10.7554/eLife.84077

Figure 5. Fenofibrate impacts mitochondrial respiratory chain efficiency but does not rescue flavin adenine dinucleotide (FAD) levels in vitamin B2-deficient diet (B2D).

(a) Fasting liver sphingolipid species (pmol/mg protein) and pool sizes by mass spectrometry (n = 4 per group). (b) Hepatic NAD/NADH ratio. (c) Fasting liver FAD and flavin mononucleotide (FMN) relative abundance by mass spectrometry (n = 4 per group). (d) Western blot analysis of oxidative phosphorylation complexes. HSP90 served as the invariant control. (e) Ratio of oxidized and reduced liver coenzyme Q10 and Q9 by mass spectrometry (n = 4 per group). Statistics are Mann–Whitney test for Ctrl vs. B2D (-FF) or Ctrl vs. B2D (+FF) for (a, b, c, e). *p<0.05, #p<0.10. Data are represented as mean ± SEM. Numerical data for individual panels are provided in Figure 5—source data 1. Full gel images are provided in Figure 5—source data 2.

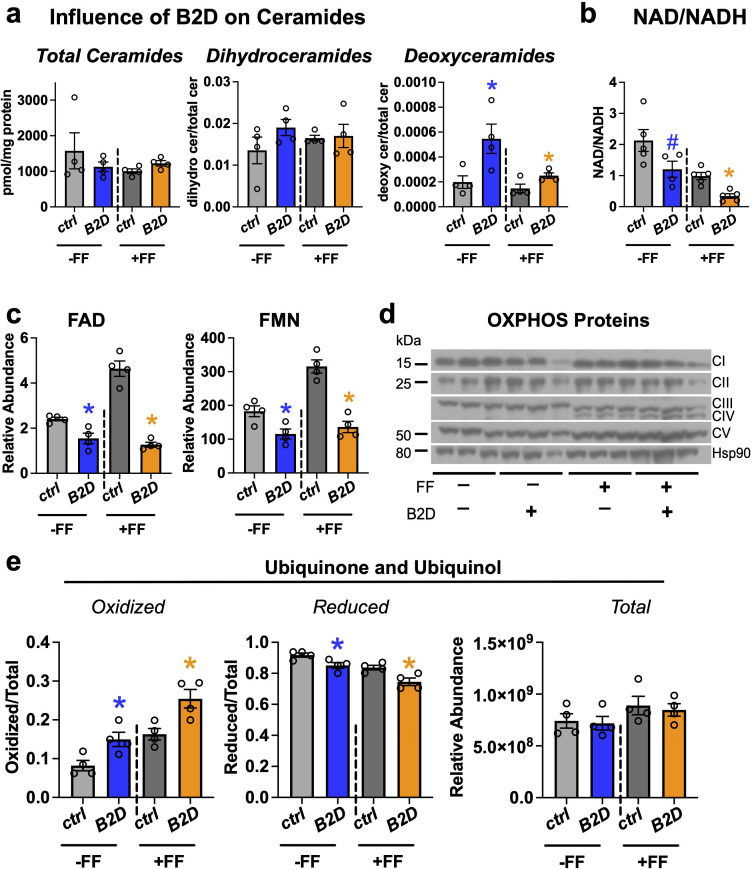
Figure 5—source data 1. Numerical data presented in Figure 5.
Excel spreadsheet containing raw data for panels presented in the figure.
Figure 5—source data 2. Full gel images and original image files for western blots in Figure 5.

Figure 5.

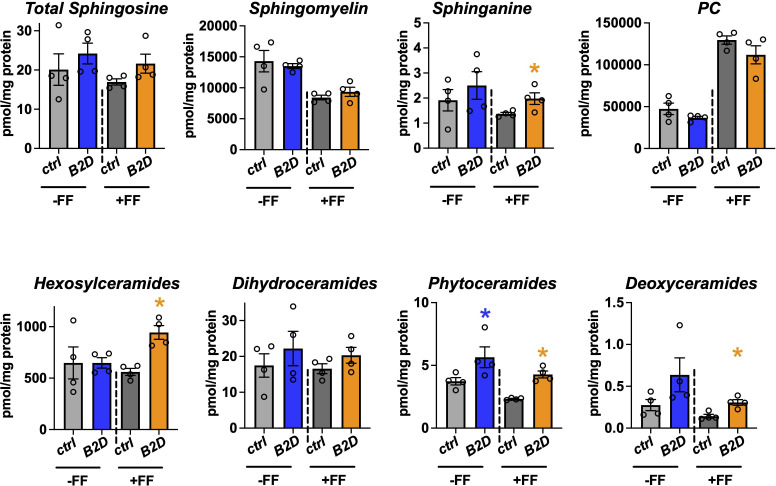
Figure 5—figure supplement 1. Vitamin B2-deficient diet (B2D) effects on sphingolipids in the liver.

Figure 5—figure supplement 1.

Fasting liver sphingolipid and ceramide species (pmol/mg protein) by mass spectrometry (n = 4 per group). Statistics are Mann–Whitney test for Ctrl vs. B2D (-FF) or Ctrl vs. B2D (+FF). *p<0.05. Data are represented as mean ± SEM. Numerical data for individual panels are provided in Figure 5—figure supplement 1—source data 1.
Figure 5—figure supplement 1—source data 1. Numerical data presented in Figure 5—figure supplement 1.
Excel spreadsheet containing raw data for panels presented in the figure.